TSN Endstation Netlink Diagnostic Workflow
The following ECI workflow illustration provides the means to address many challenges IEEE std 802.1Q-2018 support for industry-graded Debian* Linux* products.
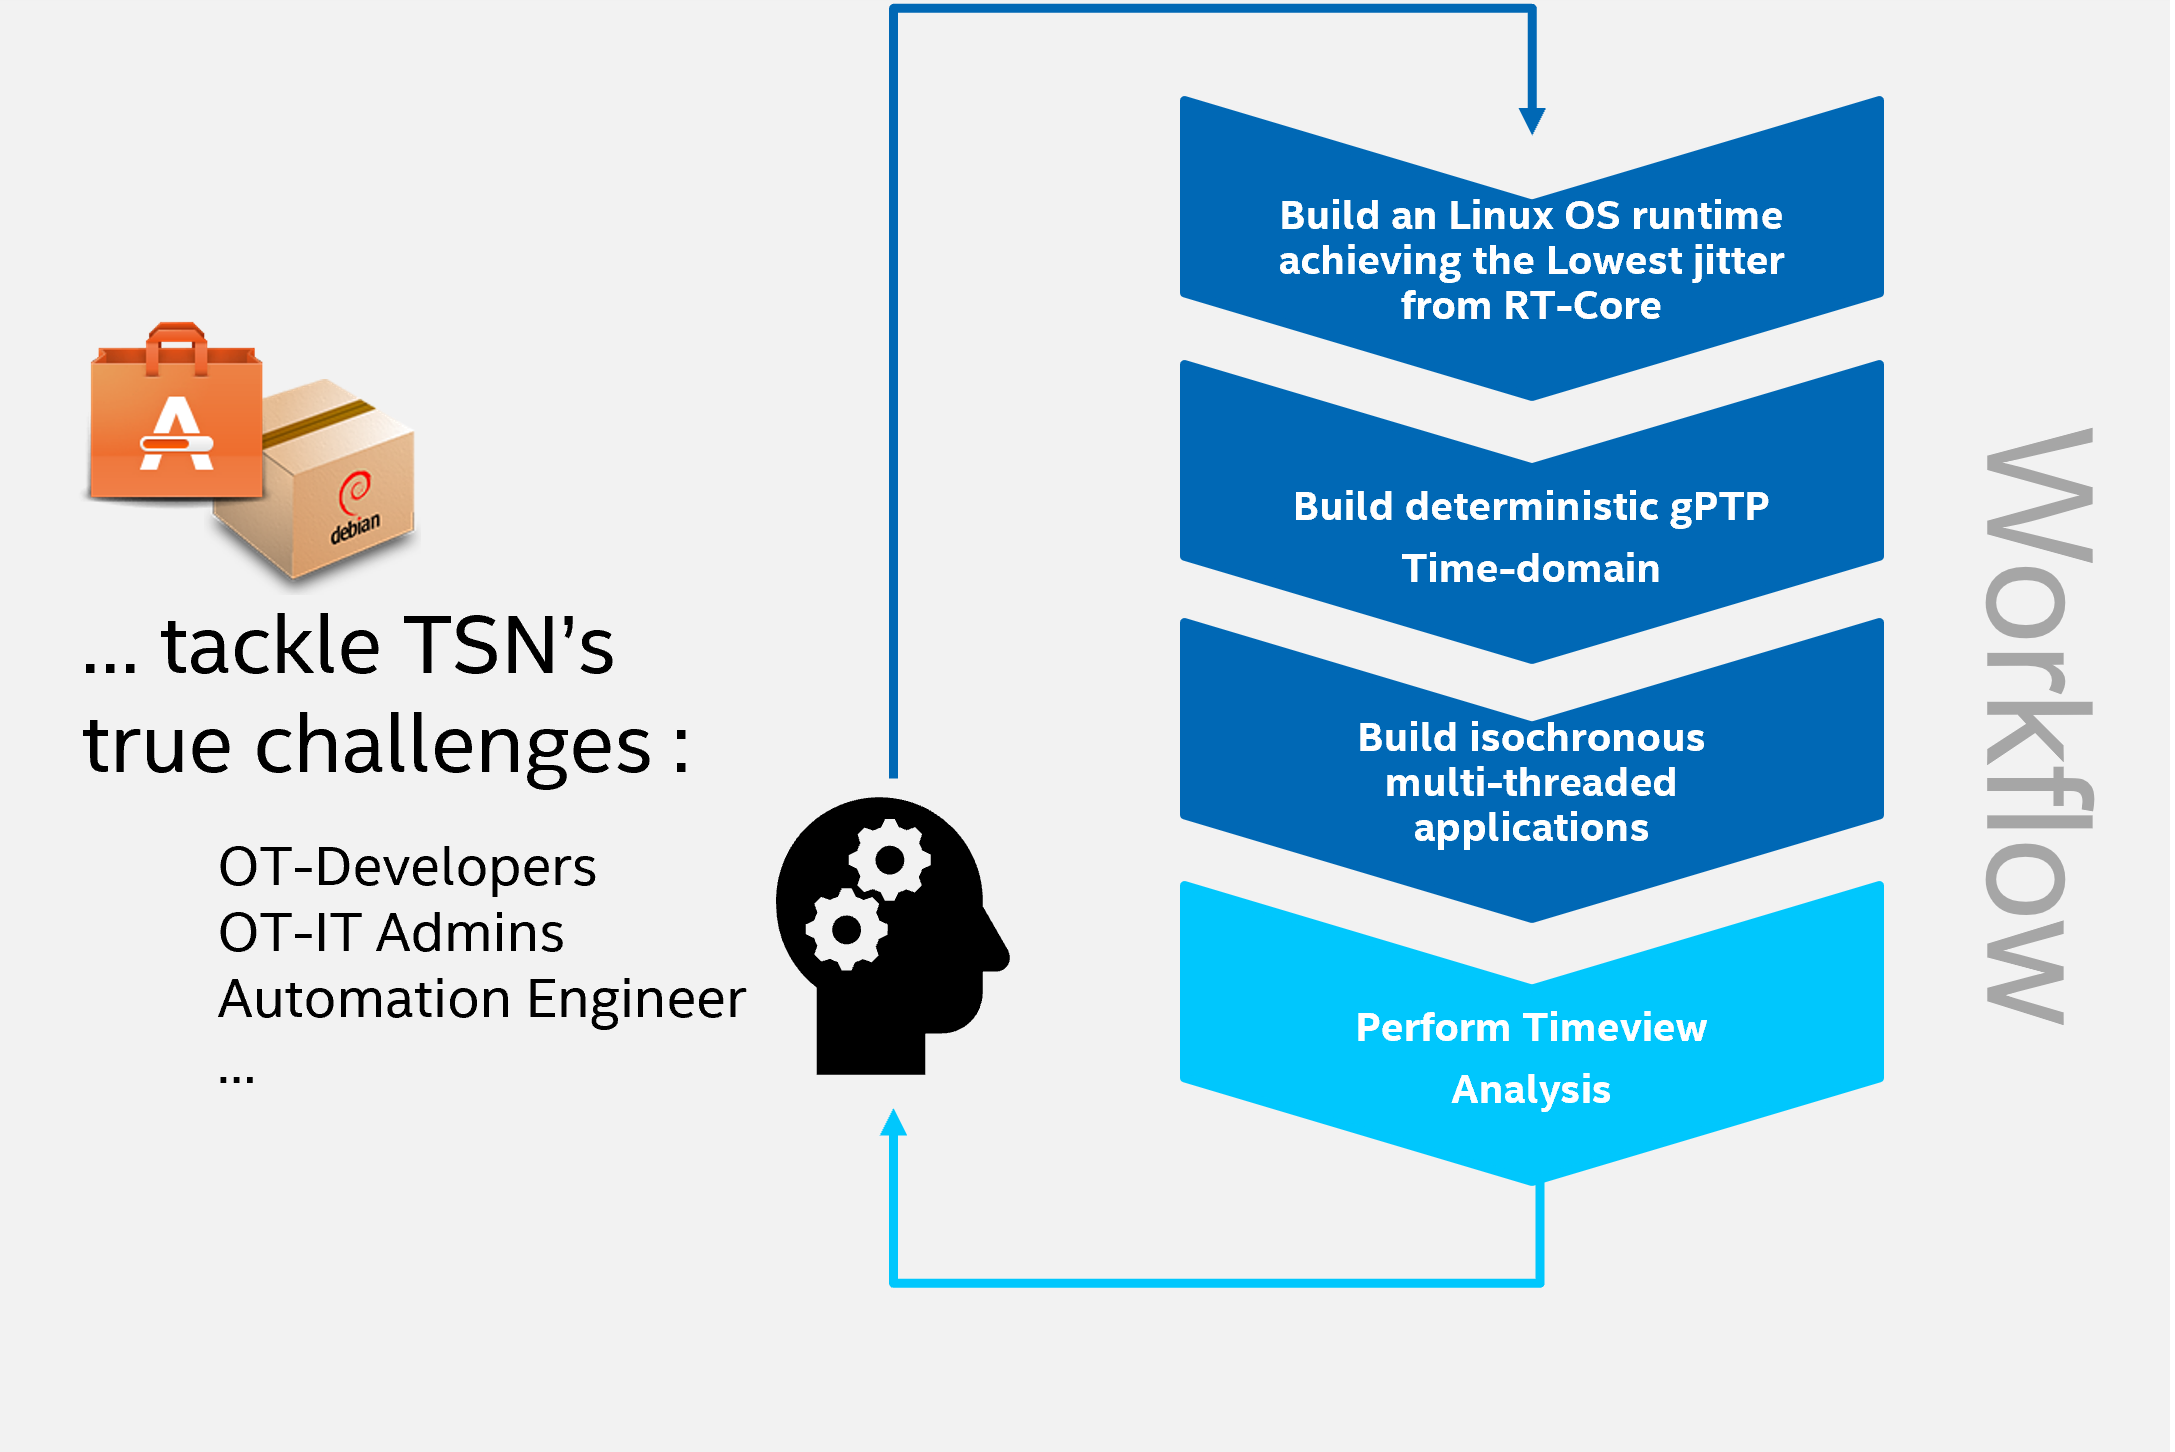
Divide and conquer the traps that might occur when exercising multi-threaded isochronous applications on a Real-time Preemptive Linux OS runtime.
Remove misleading working assumptions regarding software versus hardware, by illustrating it in a time-view.
Troubleshoot the time-division underlying Quality of Server (QoS) mechanisms in a multi-stack (for example, IEEE 60802, UAFX Controller Profile OPC 10000-084) and multi-nodes network environments.
Sanitize time-synchronized industrial applications.
Acknowledge Intel® Ethernet controllers hardware offload capabilities and Linux driver functionality.
The following section is applicable to:

Install from individual Deb package
Install the following components from the ECI APT repository. Setup the ECI APT repository, then runt following command to install this component:
$ sudo apt install checkclocks catapultReading package lists... Done Building dependency tree... Done Reading state information... Done Note, selecting 'catapult' instead of './catapult_3.0-bullseye-2.e46c81f8cf_amd64.deb' 0 upgraded, 0 newly installed, 1 reinstalled, 0 to remove and 5 not upgraded. After this operation, 0 B of additional disk space will be used. Get:1 /root/catapult_3.0-bullseye-2.e46c81f8cf_amd64.deb catapult amd64 3.0-bullseye-2.e46c81f8cf [1,088 kB] (Reading database ... 59462 files and directories currently installed.) Preparing to unpack .../catapult_3.0-bullseye-2.e46c81f8cf_amd64.deb ... Unpacking catapult (3.0-bullseye-2.e46c81f8cf) over (3.0-bullseye-2.e46c81f8cf) ... Setting up catapult (3.0-bullseye-2.e46c81f8cf) ...Start the following
systemdservices to serve the Catapult REST API from the target on port 8000:$ systemctl enable catapult-restapi.service && systemctl start catapult-restapi.service && systemctl status catapult-restapi.service? catapult-restapi.service - Catapult traceviewer REST API service Loaded: loaded (/lib/systemd/system/catapult-restapi.service; disabled; vendor preset: enabled) Drop-In: /usr/lib/systemd/system/service.d └─10-override-protect-proc.conf Active: active (running) since Thu 2018-08-30 04:50:28 UTC; 7s ago Main PID: 32902 (restapi_start.p) Tasks: 1 (limit: 9164) Memory: 36.3M CPU: 1.597s CGroup: /system.slice/catapult-restapi.service └─32902 /usr/bin/python3 /usr/share/catapult/restapi_start.py Aug 30 04:50:30 eci-intel-23f0 restapi_start.py[32902]: *** Getting all DMI data into a XML document variable Aug 30 04:50:30 eci-intel-23f0 restapi_start.py[32902]: [1535604629.925063] short-list available kernel trace events... Aug 30 04:50:30 eci-intel-23f0 restapi_start.py[32902]: [1535604629.9325438] short-list available kernel perf PMU hw-events... Aug 30 04:50:30 eci-intel-23f0 restapi_start.py[32902]: [1535604630.0594482] short-list available kernel filter functions... Aug 30 04:50:30 eci-intel-23f0 restapi_start.py[32902]: * Serving Flask app "restapi_start" (lazy loading) Aug 30 04:50:30 eci-intel-23f0 restapi_start.py[32902]: * Environment: production Aug 30 04:50:30 eci-intel-23f0 restapi_start.py[32902]: WARNING: This is a development server. Do not use it in a production deployment. Aug 30 04:50:30 eci-intel-23f0 restapi_start.py[32902]: Use a production WSGI server instead. Aug 30 04:50:30 eci-intel-23f0 restapi_start.py[32902]: * Debug mode: on Aug 30 04:50:30 eci-intel-23f0 restapi_start.py[32902]: * Running on http://0.0.0.0:8000/ (Press CTRL+C to quit)
The check_clocks Tool
The check_clocks tool is used to check time-synchronization between PTP Hardware Clocks (PHC), Linux CLOCK_TAI, and CLOCK_REALTIME system time.
Tools |
Version |
Source |
|---|---|---|
Measure Ethernet L2-PTP vs CLOCK_TAI time synchronization drift |
0.2.0 |
https://tsn.readthedocs.io/_downloads/f329e8dec804247b1dbb5835bd949e6f/check_clocks.c (with eci patchset) |
Usage
In the simplest, the following is the usage model:
$ check_clocks -d enp3s0 -vYou can interpret the Linux nanosecond time accuracy by looking at the absolute time stamps (for instance, epoch time) drift, timestamps read latencies, and time-domains delta in nanosecond:
CLOCK_TAI,CLOCK_REALTIME, and gPTP.Dumping timestamps and deltas rt tstamp: 1521111579039529335 tai tstamp: 1521111579039529428 phc tstamp: 1521111579039531493 rt latency: 45 tai latency: 40 phc latency: 8384 phc-rt delta: 2158 phc-tai delta: 2065More advanced monitoring usage model are also supported on certain Intel® Ethernet Controller supporting (PPS_CAPTUREASSERT callback pps_source_info API ):
[Endpoint PCI
8086:15f2] Intel® Ethernet Controller I225-LM for Time-Sensitive Networking (TSN)[Endpoint PCI
8086:157b,8086:1533,…] Intel® Ethernet Controller I210-T1 for Time-Sensitive Networking (TSN)You can also use the
check_clockstool with the following options:
-a- Provides accurate PTP PPS and TSN QDisc continuous tracing
-v- Displays standard output at every split-second$ check_clocks -d enp3s0 -v -aYou can interpret the Linux nanosecond time accuracy by looking at the absolute time stamps (for instance, epoch time) drift, timestamps read latencies, and time-domains delta in nanosecond:
CLOCK_TAI,CLOCK_REALTIME, and gPTP.Dumping timestamps and deltas /dev/pps1 can be enabled from /dev/ptp1 on device enp3s0 trying PPS source "/dev/pps1" found PPS source "/dev/pps1" pps-phc-timestamp: 1659421181 sequence: 63840 offset: 20726 trt_lat=56691 tai_lat=37000056791 pps-phc-timestamp: 1659421182 sequence: 63841 offset: 20826 trt_lat=23809 tai_lat=37000023940 pps-phc-timestamp: 1659421183 sequence: 63842 offset: 12756 trt_lat=22415 tai_lat=37000022504 pps-phc-timestamp: 1659421184 sequence: 63843 offset: 13223 trt_lat=17613 tai_lat=37000017742 pps-phc-timestamp: 1659421185 sequence: 63844 offset: 14361 trt_lat=17442 tai_lat=37000017579 pps-phc-timestamp: 1659421186 sequence: 63845 offset: 13982 trt_lat=17403 tai_lat=37000017530 pps-phc-timestamp: 1659421187 sequence: 63846 offset: 13296 trt_lat=19543 tai_lat=37000019634 pps-phc-timestamp: 1659421188 sequence: 63847 offset: 13794 trt_lat=16073 tai_lat=37000016198You can also use
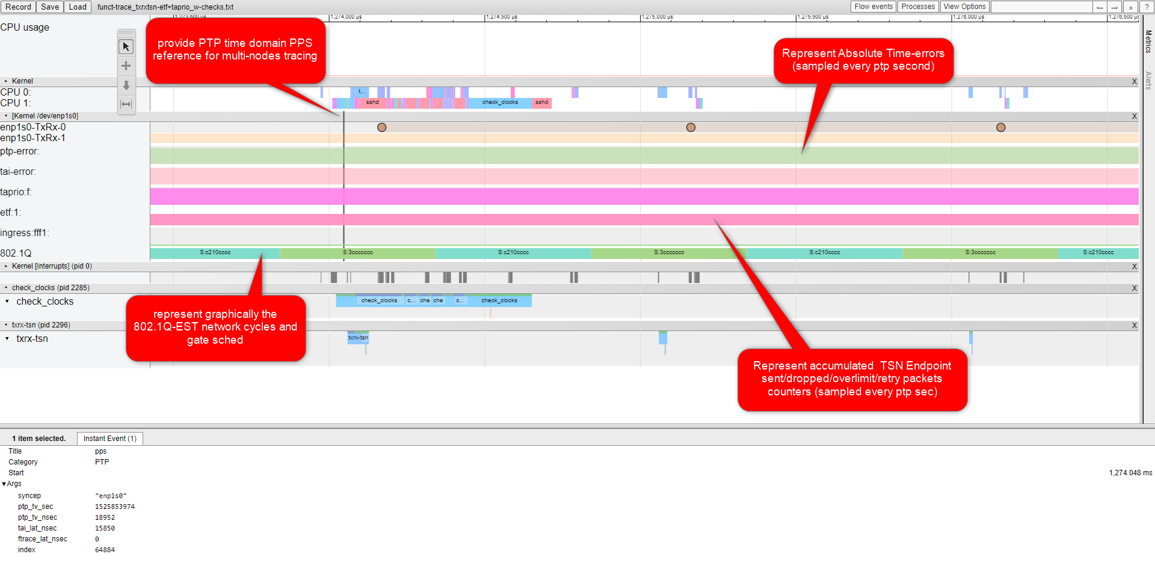
trace_event_clock_sync:of thecheck_clockstool to represent time-synchronization using the Linux/sys/kernel/debug/tracing/options/markerstracing timeline:
etf_qdisc_check:andtaprio_qdisc_check:represent QDisc time attributes that get throughAF_NETLINK(rtnetlink)
taprio_sched_check:represents QDisc time-error calculation and cyclic 802.1-2018 EST scheduling intervals
taprio_stats_check:,ingress_stats_check:, andetf_stats_check:represent QDisc statistics especially over-limit or dropped packetsecho 1 > /sys/kernel/debug/tracing/options/markers echo 1 > /sys/kernel/debug/tracing/options/record-tgid echo 0 > /sys/kernel/debug/tracing/options/overwrite echo 100000 > /sys/kernel/debug/tracing/buffer_size_kb echo global > /sys/kernel/debug/tracing/trace_clockClean and start tracing:
echo > /sys/kernel/debug/tracing/trace
echo 1 > /sys/kernel/debug/tracing/tracing_on
Stop tracing and then display the trace buffer:
cat /sys/kernel/debug/tracing/trace
# tracer: nop
#
# entries-in-buffer/entries-written: 22693/1225143   #P:2
#
#                                _-----=> irqs-off
#                               / _----=> need-resched
#                              | / _----=> need-resched_lazy
#                              || / _---=> hardirq/softirq
#                              ||| / _--=> preempt-depth
#                              ||||/     delay
#           TASK-PID     CPU#  |||||   TIMESTAMP  FUNCTION
#              | |         |   |||||      |         |
         <idle>-0       (-------) [000] d...1.. 65428.638988: cpu_idle: state=1 cpu_id=0
         <idle>-0       (-------) [001] d..h1.. 65428.639011: irq_handler_entry: irq=158 name=enp1s0
         <idle>-0       (-------) [001] d..h1.. 65428.639012: irq_handler_exit: irq=158 ret=handled
         <idle>-0       (-------) [001] dN.h4.. 65428.639013: sched_wakeup: comm=irq/158-enp1s0 pid=1473 prio=49 target_cpu=001
         <idle>-0       (-------) [001] .N..1.. 65428.639014: cpu_idle: state=4294967295 cpu_id=1
         <idle>-0       (-------) [001] d...2.. 65428.639016: sched_switch: prev_comm=swapper/1 prev_pid=0 prev_prio=120 prev_state=R ==> next_comm=irq/158-enp1s0 next_pid=1473 next_prio=49
irq/158-enp1s0-1473    (   1473) [001] d...314 65428.639028: sched_wakeup: comm=check_clocks pid=2285 prio=120 target_cpu=001
irq/158-enp1s0-1473    (   1473) [001] d...2.. 65428.639031: sched_switch: prev_comm=irq/158-enp1s0 prev_pid=1473 prev_prio=49 prev_state=S ==> next_comm=check_clocks next_pid=2285 next_prio=120
   check_clocks-2285    (   2285) [001] ....... 65428.639053: tracing_mark_write: 0: trace_event_clock_sync: parent_ts=1525853974.18952 seq=64884 tai_lat=15850 ep=enp1s0
   check_clocks-2285    (   2285) [001] d..h1.. 65428.639056: softirq_raise: vec=8 [action=HRTIMER]
   check_clocks-2285    (   2285) [001] d.L.3.. 65428.639059: sched_wakeup: comm=ksoftirqd/1 pid=21 prio=120 target_cpu=001
   check_clocks-2285    (   2285) [001] d...2.. 65428.639062: sched_switch: prev_comm=check_clocks prev_pid=2285 prev_prio=120 prev_state=R ==> next_comm=ksoftirqd/1 next_pid=21 next_prio=120
   ...
   check_clocks-2285    (   2285) [001] ....... 65427.639411: tracing_mark_write: etf_qdisc_check: id=1 clk=TAI qdelay=50000 skipsock=0 qdeadline=0 qoffload=1 ep=enp1s0
   check_clocks-2285    (   2285) [001] ....... 65427.639386: tracing_mark_write: taprio_qdisc_check: clk=PTP basetime=1525795210 flag=0x2 seq=1140581394 ep=enp1s0
   ...
   check_clocks-2285    (   2285) [001] ....... 65427.639390: tracing_mark_write: taprio_sched_check: gate0=1525853973.795210 cmd=S mask=3ccccccc cyc=1000000 ep=enp1s0
   check_clocks-2285    (   2285) [001] ....... 65427.639392: tracing_mark_write: taprio_sched_check: gate1=1525853973.1295210 cmd=S mask=c210cccc cyc=1000000 ep=enp1s0
   ...
   check_clocks-2285    (   2285) [001] ....... 65427.639395: tracing_mark_write: taprio_stats_check: id=f qpkts=199503 qdrops=9816 ovrlmt=0 retry=0 estpps=-1 ep=enp1s0
   check_clocks-2285    (   2285) [001] ....... 65427.639413: tracing_mark_write: etf_stats_check: id=1 qpkts=1998 qdrops=2 ovrlmt=1 retry=0 estpps=-1 ep=enp1s0
   check_clocks-2285    (   2285) [001] ....... 65427.639421: tracing_mark_write: ingress_stats_check: id=fff1 qpkts=0 qdrops=0 ovrlmt=0 retry=0 estpps=-1 ep=enp1s0
   ...
Ethernet/TSN Time-view - Trace af_packet Events
The following section is applicable to any Host (Windows, Linux):

Open http://<target ipv4>:8000 on common Internet Browser.

Note
Google* Chrome/Chromium or Microsoft* Edge are recommended. Opera* and Safari* browsers were not tried extensively, but are potential alternatives. Firefox* may be slow and Microsoft Internet Explore is incompatible.

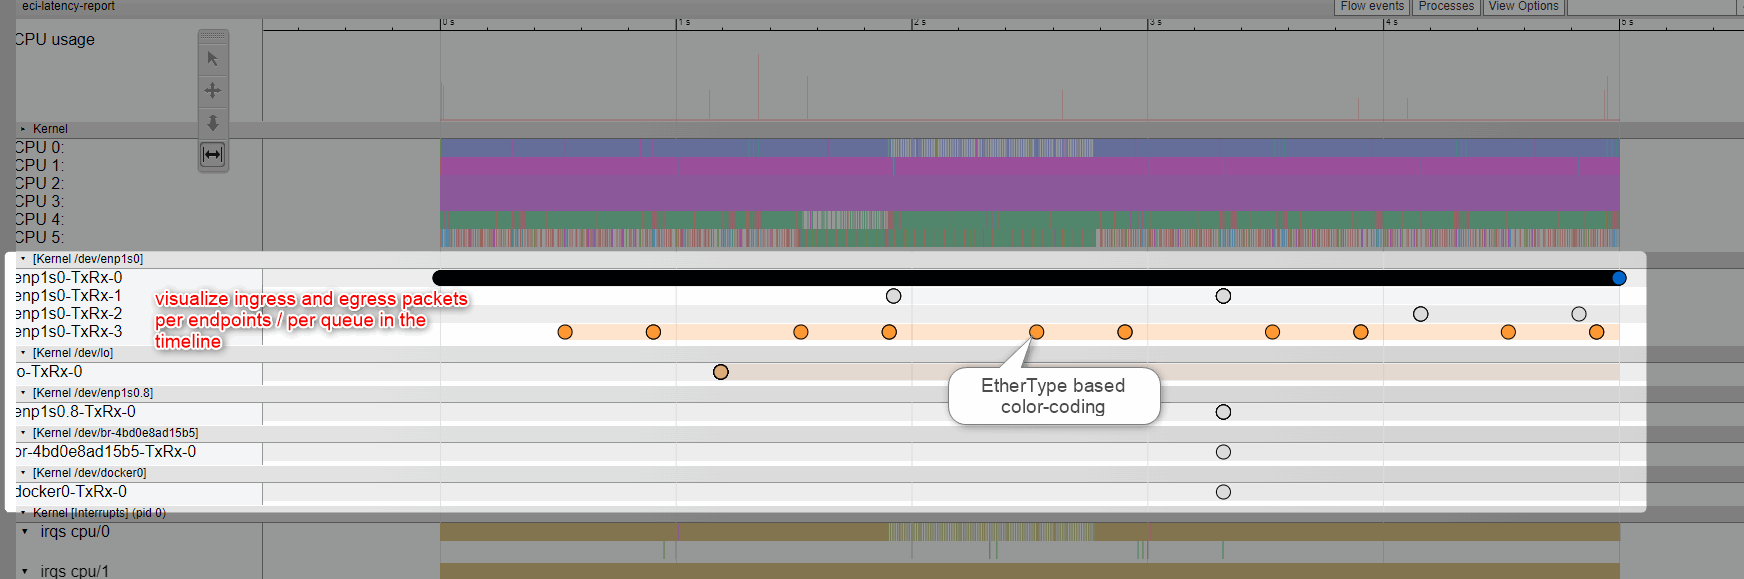
Intel® ECI makes generic assumptions that the Linux Ethernet/TSN usage model essentially leverages Linux system-level trace events and user-recorded significant timeline for IEEE std 802.1Q-2018 Linux af_packet traffic representation:
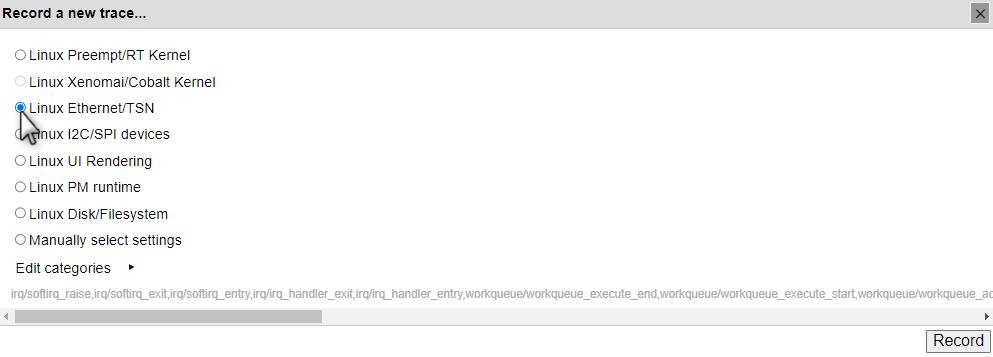
Click Edit categories to view the full trace event configuration details. You can record a trace for manually selected settings instead of the default Linux Ethernet/TSN.
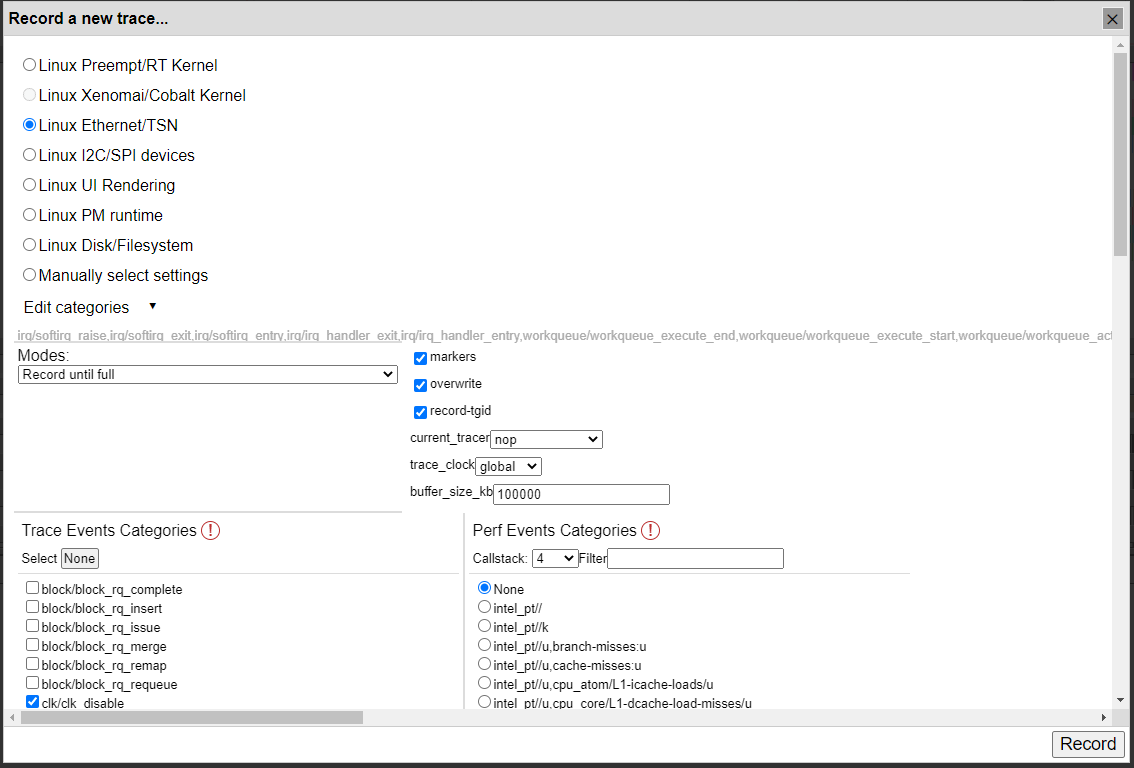
While editing, you have the option to record in two Modes:
Record until full - This mode will display a progress bar corresponding to the full percentage of the trace buffer, polled periodically using Catapult REST API GET call
http://<machine-ipv4>:8000/json/get_buffer_percent_full.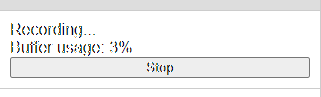
Record continuously - This mode will record silently until you click Stop.

Click Record. The catapult REST API GET call http://<machine-ipv4>:8000/json/begin_recording?<base64 encoded user-config> will pass the default Linux Ethernet/TSN pre-canned configuration:
Linux
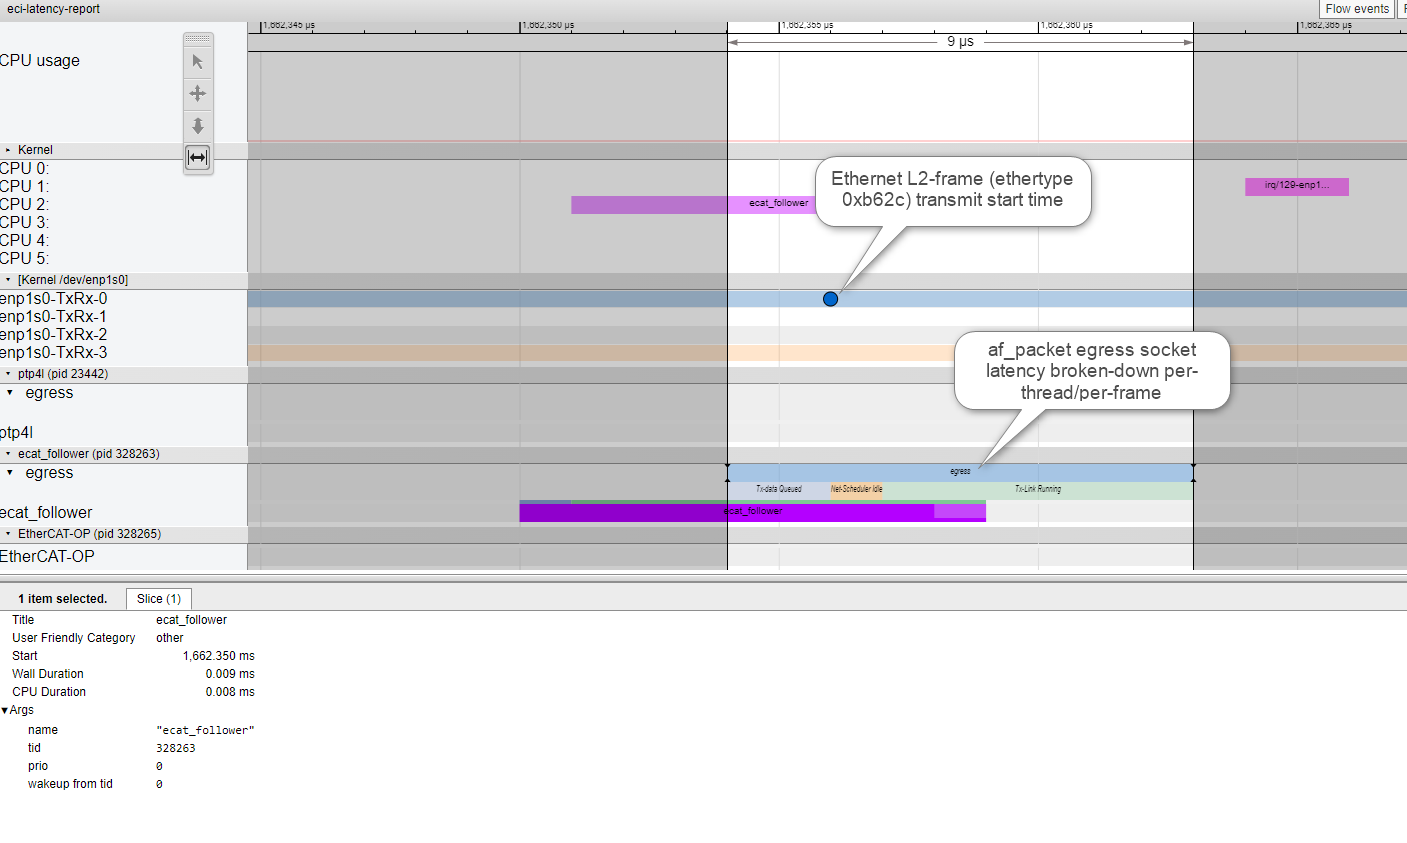
netdevegress Ethernet traffic representation using thenet_dev_start_xmit,net_dev_xmit,net_dev_queue, andnet_dev_xmit_timeouteventsLinux
netifingress Ethernet traffic representation using thenetif_rx_ni_entryandnetif_rx_ni_exiteventsLinux
napiingress Ethernet traffic representation using thenapi_gro_receive_entryandnapi_gro_receive_exiteventsLinux Scheduler FSM representation using the
sched_switchandsched_wakeupeventsLinux interrupt handlers representation using all
irqeventsLinux kernel drivers work-queues job representation using all
workqueueeventsLinux CPU idle and frequency representation using
cpu_idle,clock_set_rate``y, and ``cpu_frequencyevents
Click to view the equivalent manual command line
Activate events:
echo 1 > /sys/kernel/debug/tracing/events/net/net_dev_start_xmit/enable
echo 1 > /sys/kernel/debug/tracing/events/net/net_dev_xmit/enable
echo 1 > /sys/kernel/debug/tracing/events/net/net_dev_queue/enable
echo 1 > /sys/kernel/debug/tracing/events/net/net_dev_xmit_timeout/enable
echo 1 > /sys/kernel/debug/tracing/events/net/netif_rx_ni_entry/enable
echo 1 > /sys/kernel/debug/tracing/events/net/netif_rx_ni_exit/enable
echo 1 > /sys/kernel/debug/tracing/events/net/netif_rx_entry/enable
echo 1 > /sys/kernel/debug/tracing/events/net/netif_rx_exit/enable
echo 1 > /sys/kernel/debug/tracing/events/net/napi_gro_receive_entry/enable
echo 1 > /sys/kernel/debug/tracing/events/net/napi_gro_receive_exit/enable
echo 1 > /sys/kernel/debug/tracing/events/sched/sched_switch/enable
echo 1 > /sys/kernel/debug/tracing/events/sched/sched_wakeup/enable
echo 1 > /sys/kernel/debug/tracing/events/power/cpu_idle/enable
echo 1 > /sys/kernel/debug/tracing/events/power/cpu_frequency/enable
echo 1 > /sys/kernel/debug/tracing/events/power/clock_set_rate/enable
echo 1 > /sys/kernel/debug/tracing/events/workqueue/enable
echo 1 > /sys/kernel/debug/tracing/events/irq/enable
tracing/options/overridedisable flushingtracing/traceftrace buffer on every new recordtracing/options/record-tgidadd column process-id orTASK-PIDtracing/buffer_size_kbsize ftrace buffers, for example 100000 equivalent to 100 MB for each CPU core
Click to view the equivalent manual command line
Select tracing options:
echo 100000 > /sys/kernel/debug/tracing/buffer_size_kb
echo 1 > /sys/kernel/debug/tracing/options/record-tgid
echo 0 > /sys/kernel/debug/tracing/options/overwrite
echo global > /sys/kernel/debug/tracing/trace_clock
echo > /sys/kernel/debug/tracing/trace
echo 1 > /sys/kernel/debug/tracing/tracing_on
Click Stop. The catapult REST API GET call http://<machine-ipv4>:8000/json/end_recording_compressed?<base64 encoded compressed-json trace dump> retrieves and renders the trace JSON record onto the time-view UI.
Click to view the equivalent manual command line
Stop tracing, and then redirect the standard output trace buffer to a temporary file:
echo 0 > /sys/kernel/debug/tracing/tracing_on
cat /sys/kernel/debug/tracing/trace > /tmp/trace.txt
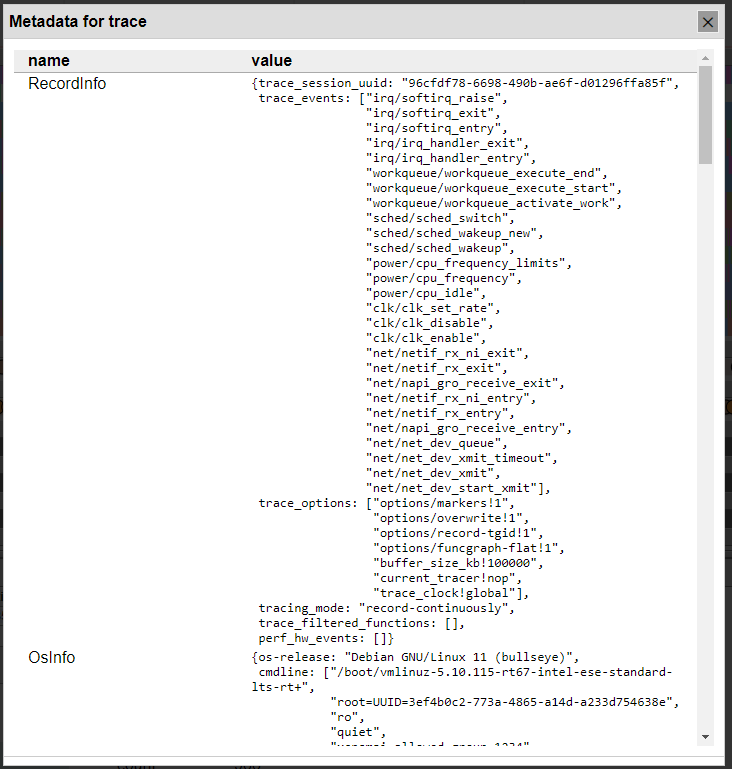
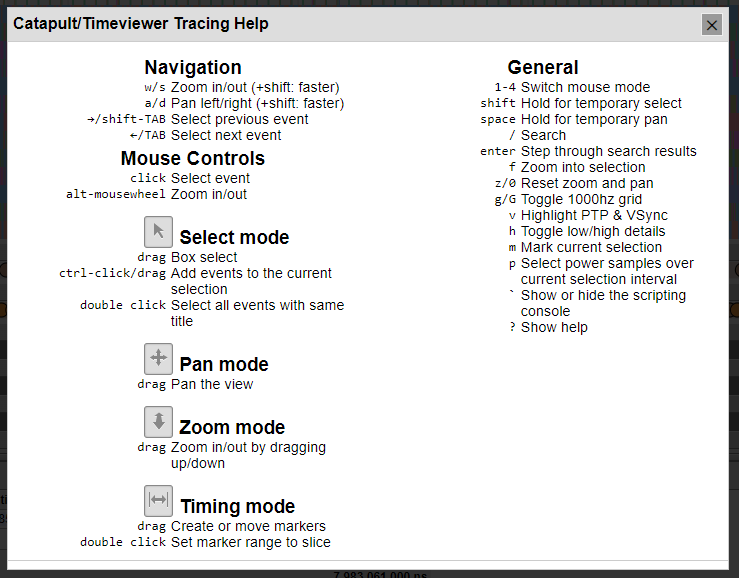
The ? Helper and M Meta-data helper buttons explain navigation options and tracing configuration to reconcile the recording context.
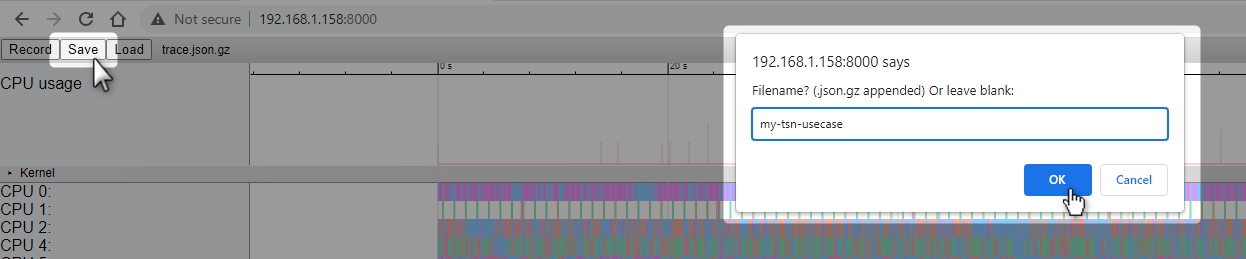
You can also click Save to archive to the trace_my-tsn-usecase.json.gz file for redistribution.
Ethernet/TSN Time-view - Trace af_packet Events with Advanced function_graph
Important
The tracing/options/funcgraph-flat enable low-overhead function-graph tracer it allow to compress function Entry or Exit into a single Trace event (kernel tracing CONFIG_TRACE_GRAPH_PRINT_FLAT).
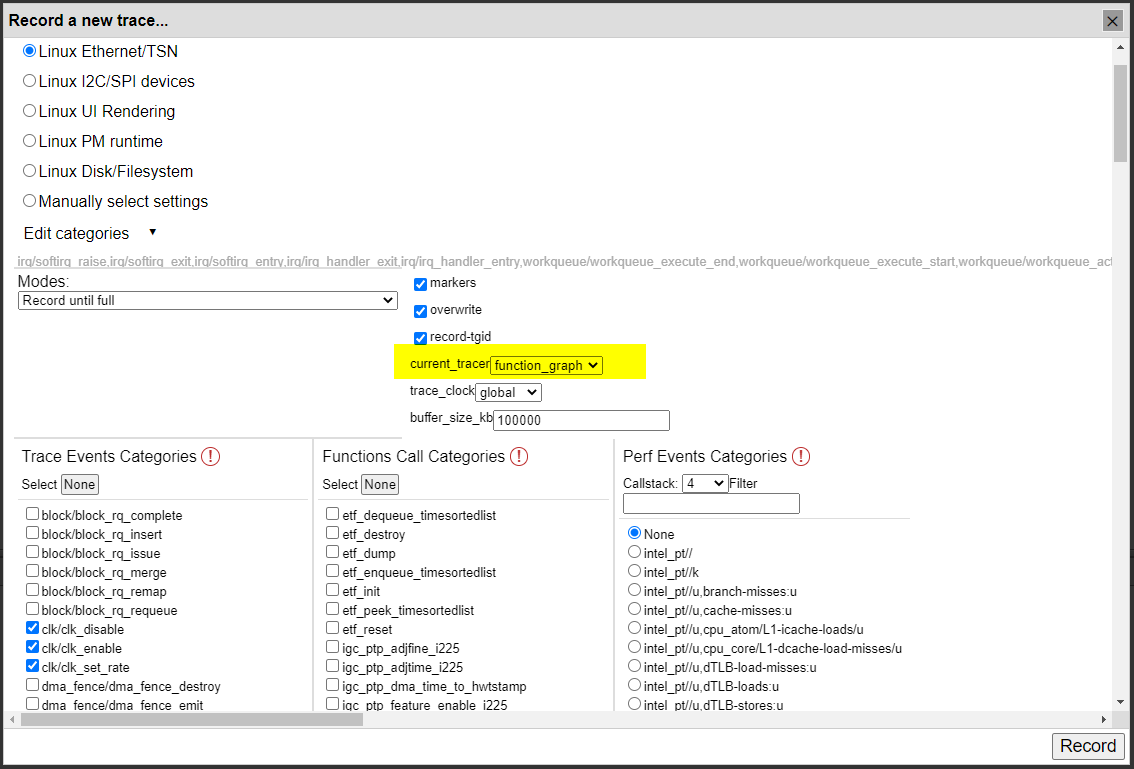
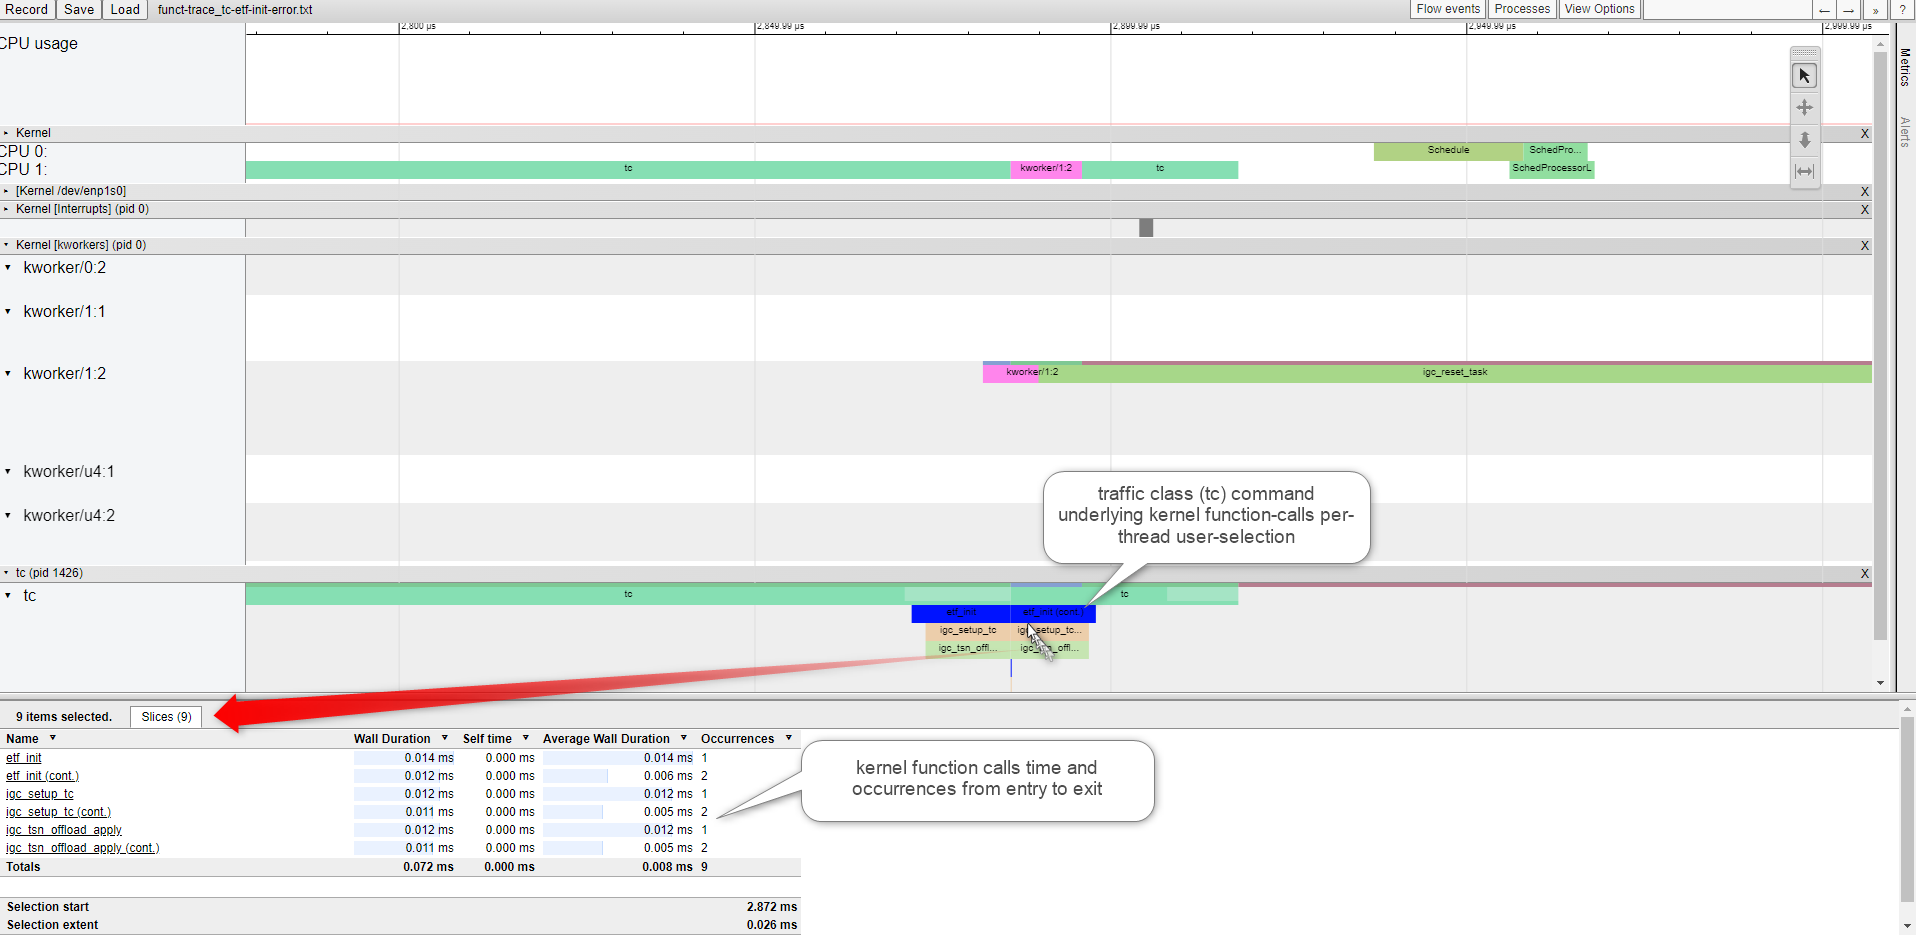
Intel® ECI makes generic assumptions regarding the Linux Ethernet/TSN* usage Linux af_packet events with Linux function tracing Entry/Exit time.
The catapult REST API GET call http://<machine-ipv4>:8000/json/begin_recording?<base64 encoded user-config> passes the resulting Manually select settings trace events and filtered function configurations.
Click to view the equivalent manual command line
echo 0 > /sys/kernel/debug/tracing/tracing_on
echo 1 > /sys/kernel/debug/tracing/options/funcgraph-abstime
echo 1 > /sys/kernel/debug/tracing/options/funcgraph-cpu
echo 1 > /sys/kernel/debug/tracing/options/funcgraph-proc
echo 1 > /sys/kernel/debug/tracing/options/funcgraph-flat
From the
available_filter_functions, ONLY enable the relevant IEEE std 802.1Q-2018. For example, QDisc TAPRIO, QDisc ETF, or both.echo "etf_reset" > /sys/kernel/debug/tracing/set_ftrace_filter echo "etf_enqueue_timesortedlist" >> /sys/kernel/debug/tracing/set_ftrace_filter echo "etf_peek_timesortedlist" >> /sys/kernel/debug/tracing/set_ftrace_filter echo "etf_dequeue_timesortedlist" >> /sys/kernel/debug/tracing/set_ftrace_filter echo "etf_init" >> /sys/kernel/debug/tracing/set_ftrace_filter echo "etf_reset" >> /sys/kernel/debug/tracing/set_ftrace_filter echo "etf_destroy" >> /sys/kernel/debug/tracing/set_ftrace_filter echo "etf_dump" >> /sys/kernel/debug/tracing/set_ftrace_filter echo "taprio_reset" >> /sys/kernel/debug/tracing/set_ftrace_filter echo "taprio_enqueue" >> /sys/kernel/debug/tracing/set_ftrace_filter echo "taprio_peek" >> /sys/kernel/debug/tracing/set_ftrace_filter echo "taprio_peek_offload" >> /sys/kernel/debug/tracing/set_ftrace_filter echo "taprio_peek_soft" >> /sys/kernel/debug/tracing/set_ftrace_filter echo "taprio_dequeue" >> /sys/kernel/debug/tracing/set_ftrace_filter echo "taprio_dequeue_offload" >> /sys/kernel/debug/tracing/set_ftrace_filter echo "taprio_dequeue_soft" >> /sys/kernel/debug/tracing/set_ftrace_filter echo "taprio_walk" >> /sys/kernel/debug/tracing/set_ftrace_filter echo "taprio_change" >> /sys/kernel/debug/tracing/set_ftrace_filter echo "taprio_destroy" >> /sys/kernel/debug/tracing/set_ftrace_filter echo "taprio_dump" >> /sys/kernel/debug/tracing/set_ftrace_filter echo "taprio_init" >> /sys/kernel/debug/tracing/set_ftrace_filter
[Endpoint PCI
8086:15f2] Intel® Ethernet Controller I225-LM for Time-Sensitive Networking (TSN)echo "igc_setup_tc" >> /sys/kernel/debug/tracing/set_ftrace_filter echo "igc_reset" >> /sys/kernel/debug/tracing/set_ftrace_filter echo "igc_tsn_new_flags" >> /sys/kernel/debug/tracing/set_ftrace_filter echo "igc_tsn_enable_offload" >> /sys/kernel/debug/tracing/set_ftrace_filter echo "igc_tsn_offload_apply" >> /sys/kernel/debug/tracing/set_ftrace_filter echo "igc_ptp_tx_hang" >> /sys/kernel/debug/tracing/set_ftrace_filter echo "igc_ptp_rx_pktstamp" >> /sys/kernel/debug/tracing/set_ftrace_filter echo "igc_ptp_suspend" >> /sys/kernel/debug/tracing/set_ftrace_filter echo "igc_ptp_reset" >> /sys/kernel/debug/tracing/set_ftrace_filter echo "igc_ptp_read" >> /sys/kernel/debug/tracing/set_ftrace_filter echo "igc_ptp_init" >> /sys/kernel/debug/tracing/set_ftrace_filter echo "igc_ptp_stop" >> /sys/kernel/debug/tracing/set_ftrace_filter
[Endpoint PCI
8086:157b,8086:1533,…] Intel® Ethernet Controller I210-T1 for Time-Sensitive Networking (TSN)echo "igb_reset" >> /sys/kernel/debug/tracing/set_ftrace_filter echo "igb_tx_timeout" >> /sys/kernel/debug/tracing/set_ftrace_filter echo "igb_config_tx_modes" >> /sys/kernel/debug/tracing/set_ftrace_filter echo "igb_ptp_settime_i210" >> /sys/kernel/debug/tracing/set_ftrace_filter echo "igb_ptp_feature_enable" >> /sys/kernel/debug/tracing/set_ftrace_filter echo "igb_ptp_verify_pin" >> /sys/kernel/debug/tracing/set_ftrace_filter echo "igb_ptp_set_timestamp_mode" >> /sys/kernel/debug/tracing/set_ftrace_filter echo "igb_ptp_overflow_check" >> /sys/kernel/debug/tracing/set_ftrace_filter echo "igb_ptp_feature_enable_i210" >> /sys/kernel/debug/tracing/set_ftrace_filter echo "igb_ptp_gettimex_i210" >> /sys/kernel/debug/tracing/set_ftrace_filter echo "igb_ptp_adjtime_i210" >> /sys/kernel/debug/tracing/set_ftrace_filter echo "igb_ptp_systim_to_hwtstamp" >> /sys/kernel/debug/tracing/set_ftrace_filter echo "igb_ptp_tx_work" >> /sys/kernel/debug/tracing/set_ftrace_filter echo "igb_ptp_rx_hang" >> /sys/kernel/debug/tracing/set_ftrace_filter echo "igb_ptp_tx_hang" >> /sys/kernel/debug/tracing/set_ftrace_filter echo "igb_ptp_rx_pktstamp" >> /sys/kernel/debug/tracing/set_ftrace_filter echo "igb_ptp_rx_rgtstamp" >> /sys/kernel/debug/tracing/set_ftrace_filter echo "igb_ptp_get_ts_config" >> /sys/kernel/debug/tracing/set_ftrace_filter echo "igb_ptp_set_ts_config" >> /sys/kernel/debug/tracing/set_ftrace_filter echo "igb_ptp_suspend" >> /sys/kernel/debug/tracing/set_ftrace_filter echo "igb_ptp_stop" >> /sys/kernel/debug/tracing/set_ftrace_filter echo "igb_ptp_reset" >> /sys/kernel/debug/tracing/set_ftrace_filter echo "igb_ptp_init" >> /sys/kernel/debug/tracing/set_ftrace_filterEnable
function_graphas the current tracer. Then, clean and start tracing:echo function-trace > /sys/kernel/debug/tracing/trace_options echo function_graph > /sys/kernel/debug/tracing/current_tracer echo > /sys/kernel/debug/tracing/trace echo 1 > /sys/kernel/debug/tracing/tracing_onStop tracing and send the standard output trace buffer to a file:
echo 0 > /sys/kernel/debug/tracing/tracing_on
cat /sys/kernel/debug/tracing/trace > /tmp/func-trace.txt
When you click Stop, catapult REST API GET call http://<machine-ipv4>:8000/json/end_recording_compressed?<base64 encoded compressed-json trace dump> will retrieve and render the trace JSON record onto the time-view UI.
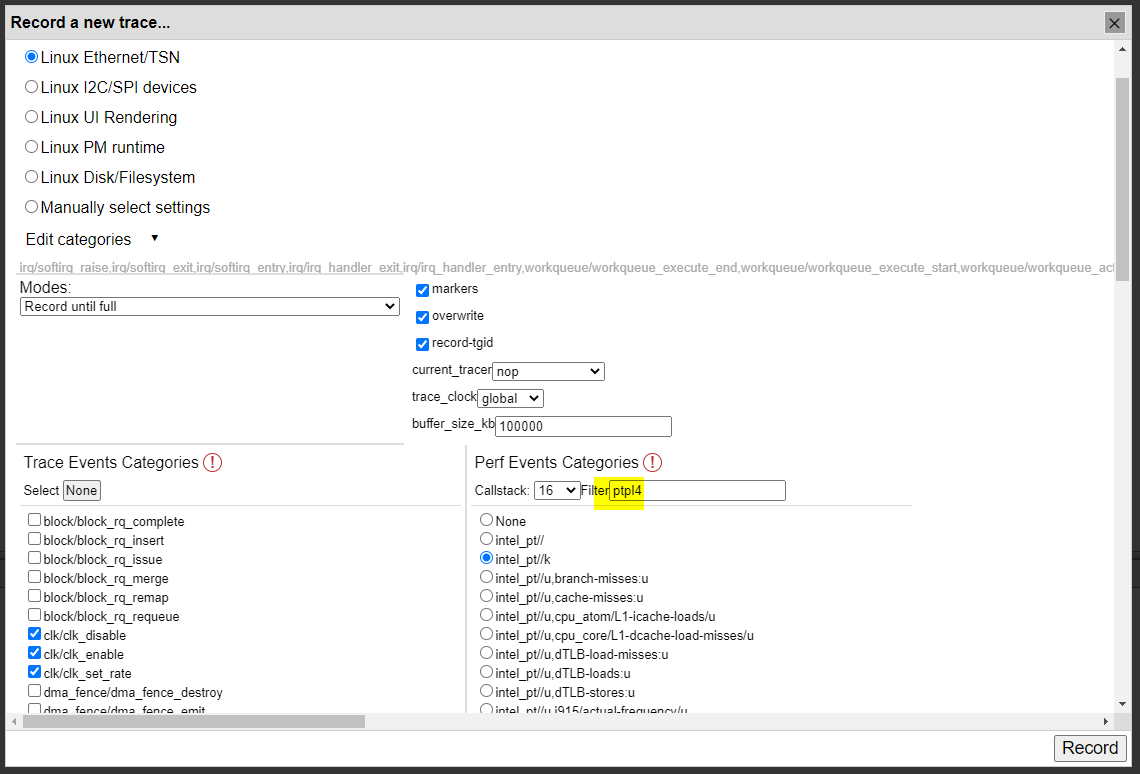
Ethernet/TSN Time-view - Trace af_packet Events with Advanced intel_pt//
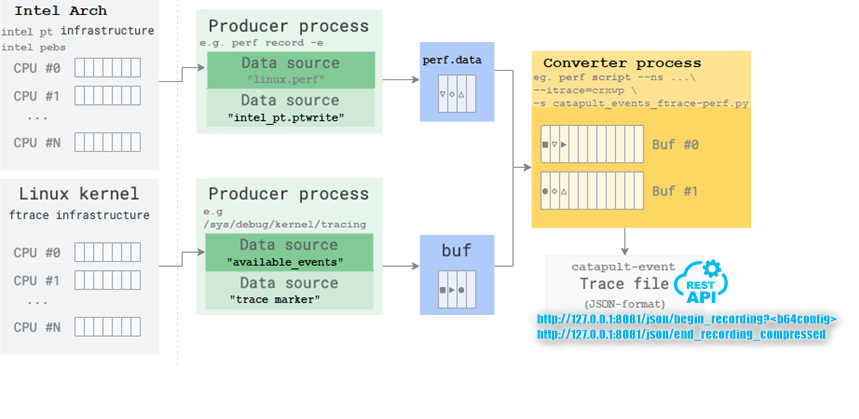
A more advanced usage model can combine Linux af_packet events with Linux perf event tracing, such as perf/intel_pt.
Intel® ECI makes generic assumptions about the perf-intel-pt features usage model using perf record and perf scripts available options:
Important
It is highly recommended that with
intel_pt/branch=1/,intel_pt//k,intel_pt//, orintel_pt/cyc=1/u, record configurations to Filter branch on a particular process name (ptp4lin this example) to avoid decoding and loading congestion:
intel_pt/branch=1/usaveintel_ptrecords all branches call and returns user space ONLY across all cores
intel_pt//ksaveintel_ptrecords all branches call and returns ONLY kernel space across all cores
intel_pt//saveintel_ptrecords all branches call and returns type user space and kernel space across all cores
intel_pt/cyc=1/uperfinstructions hardware counter derived from theintel_ptbranch records across all cores
intel_pt/branch=0,ptw=1/saveintel_ptrecords onlyPTWRITEfrom all cores and disabled ifcpuidis not supported
intel_pt/branch=0,pwr_evt=1/saveintel_ptrecords onlyPOWER EVENTSfrom all cores and disabled ifcpuidis not supported
intel_pt//u,branch-misses:usaveintel_ptcall-graph of allbranch-missesuser space records from all cores
intel_pt//u,<perf-event>:usaveintel_ptcall-graph for a particularperfevent user space records from all cores
Click Record. The catapult REST API GET call http://<machine-ipv4>:8000/json/begin_recording?<base64 encoded user-config> passes the resulting Manually select settings trace events and Linux perf configurations:
Click to view the equivalent manual command line
echo > /sys/kernel/debug/tracing/trace && \
echo /proc/kallsym > /tmp/kallsym.log
echo 'kernel.kptr_restrict=0' >> /etc/sysctl.conf
echo 1 > /sys/kernel/debug/tracing/tracing_on && \
perf record -e '{intel_pt//}' -a sleep 1 && -p <ptp4l pid> \
echo 0 > /sys/kernel/debug/tracing/tracing_on
cat /sys/kernel/debug/tracing/trace > /tmp/trace.txt perf script -i perf.data \ --kallsym /tmp/kallsym.log --ns --itrace=crxwp \ -s /usr/shared/catapult/catapult_ftrace-perf.py -- \ --input /tmp/trace.txt -t -f json \ -o /tmp/perf+ftrace_intel-pt.json
Click Stop. The catapult REST api GET call http://<machine-ipv4>:8000/json/end_recording_compressed?<base64 encoded compressed-json trace dump> retrieves and renders the trace JSON record onto the time-view UI.
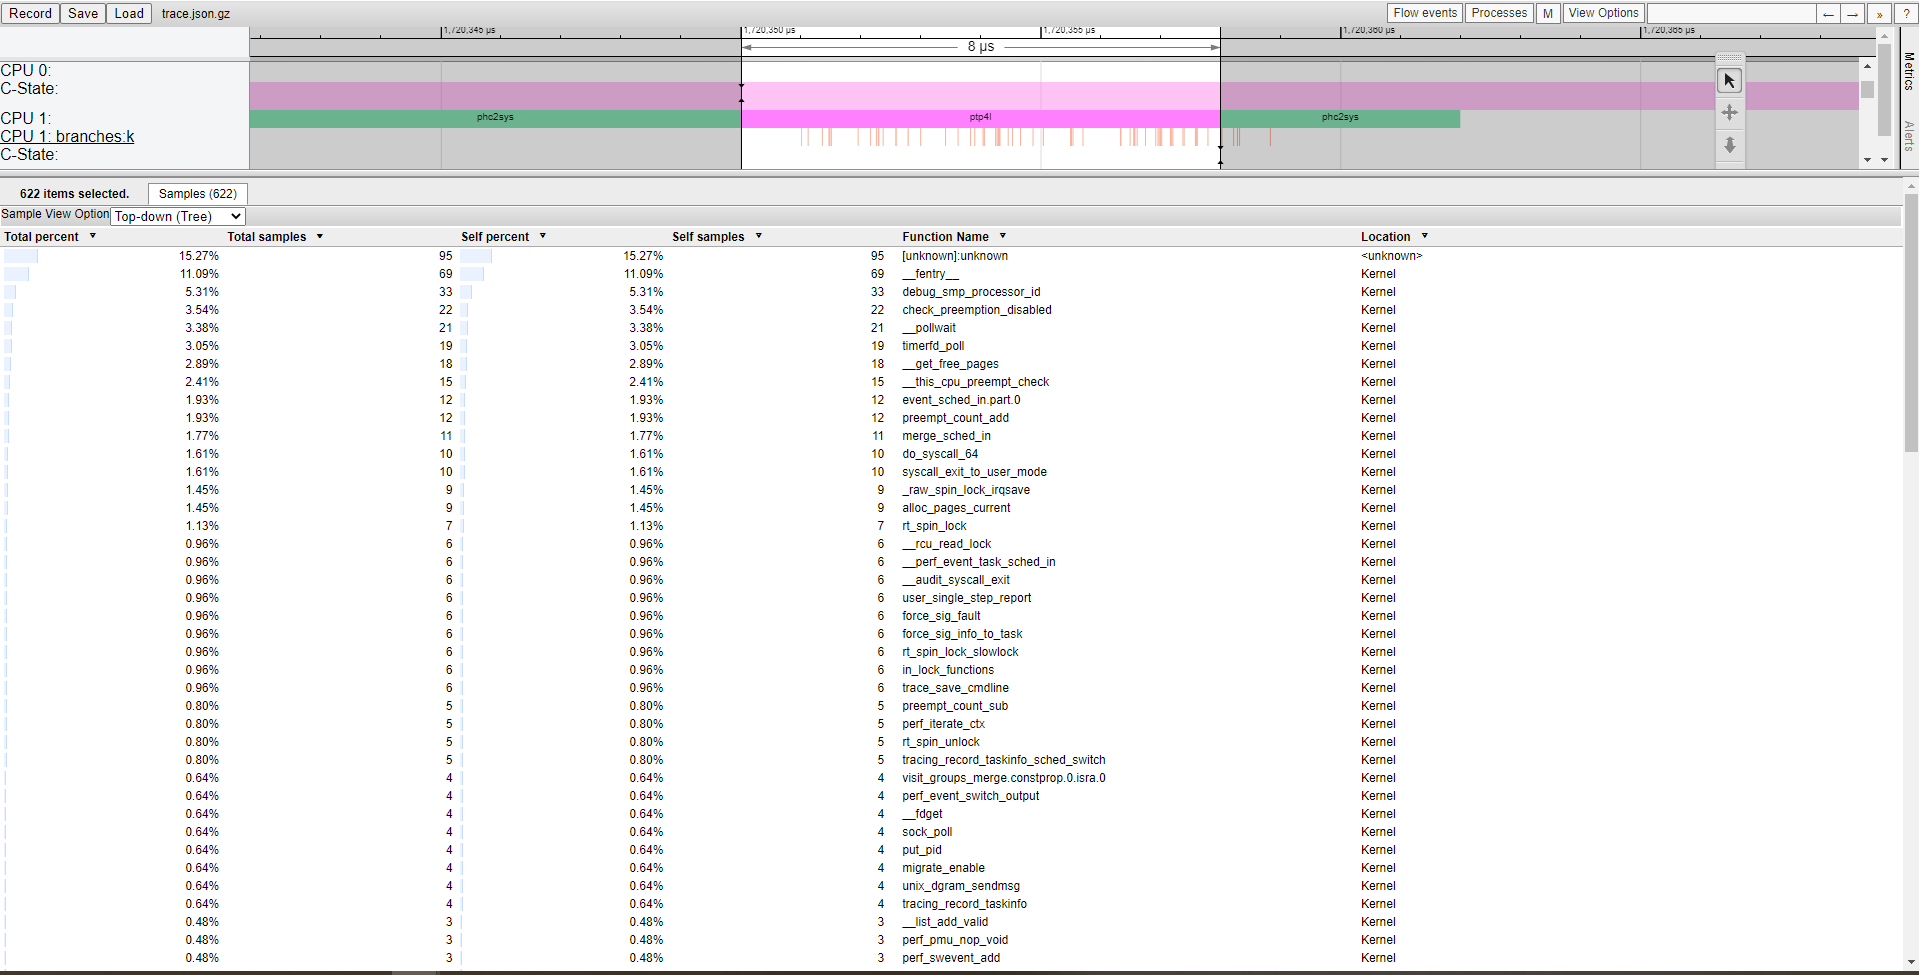
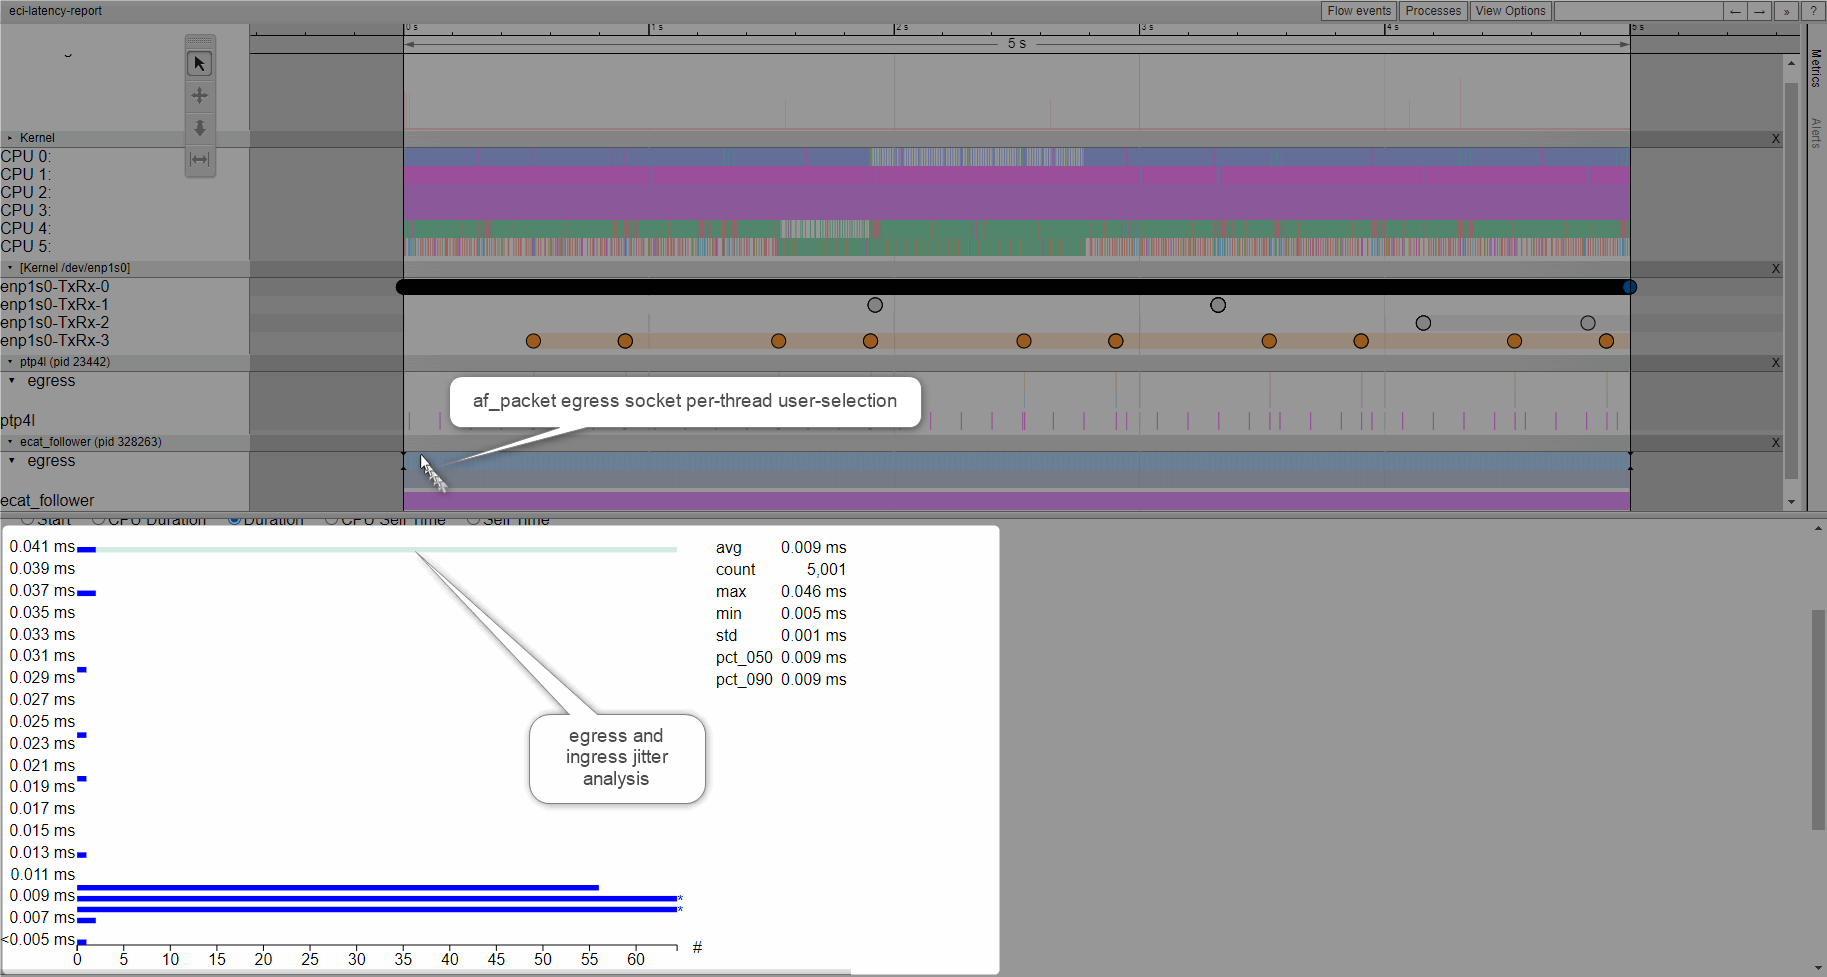
The ECI documentation instantiates a local time-view UI for sharing archives file and performs a event timeline deep-dive analysis.