Troubleshoot
See also
For questions and answers, visit the Edge Controls for Industrial online support forum.
The techniques presented in this section will help in exposing the underlying cause of latency and jitter in real-time applications.
The following section is applicable to:

Use Linux Events Tracing (ftrace) to Report Latency Outliers
To learn how to trace events on the Linux kernel, refer to Use Linux Events Tracing (ftrace) to Report Latency Outliers.
Monitor CPU Utilization and Affinity
To ensure that the workloads run isolated on CPUs, monitor the tasks currently running. The utility htop enables monitoring of task CPU affinity.
htop is an interactive system-monitor process-viewer and process-manager. It is designed as an alternative to the Unix program top. It shows a frequently updated list of the processes running on a computer, normally ordered by the amount of CPU usage. htop provides a complete list of processes running, instead of the top resource-consuming processes. htop uses color and provides a visual representation of processor, swap, and memory status.
Install htop:
$ sudo apt install htop
Run htop:
$ htop
You can include additional columns to the output of htop. To configure htop to filter tasks by CPU affinity, do the following:
Press the F2 key to open the menu system
Press the ↓ down arrow key until Columns is selected from the Setup category
Press the → right arrow key to until the selector moves to the Available Columns section
Press the ↓ down arrow key until PROCESSOR is selected from the Available Columns section
Press the Enter key to add PROCESSOR to the Active Columns section
Press the F10 key to complete the addition
Press the F6 key to open the Sort by menu
Use the ← →↑↓ arrow keys to move the selection to PROCESSOR
Press the Enter key to filter tasks by processor affinity
After filtering tasks by CPU affinity, verify that real-time workloads are isolated; real-time workloads should not share a CPU.
Note: Workloads may consist of many individual child tasks. These child tasks are constituent to the workload and it is acceptable and preferred that they run on the same CPU.
Monitor Kernel Interrupts
The Linux kernel is often a source of unwanted interrupts. You can monitor the number of interrupts that occur on a CPU by running the following command:
$ watch -n 0.1 cat /proc/interrupts
This command polls the processor every 100 milliseconds and displays the interrupt counts. Ideally, isolated CPUs 1, 2, and 3 should not show any incrementing interrupt counts. In practice, the Linux “Local timer interrupt” may still be occurring, but properly prioritized workloads should not be impacted.
Determine CPU Cache Allocation
Using Cache Allocation Technology improperly can have detrimental effects on a real-time workload. It is important to verify that cache partitioning is properly configured, otherwise increased cache misses might occur. You can modify the cache allocation using the pqos tool.
The pqos tool can be installed from the ECI repository. Setup the ECI repository, then perform the following command to install this component:
$ sudo apt install intel-cmt-cat
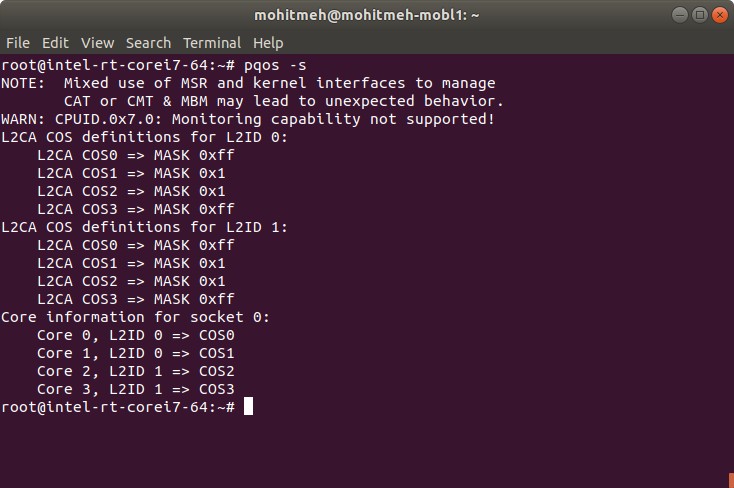
Use the following command to verify CAT configuration:
$ pqos -s
An example output from a target system utilizing CAT is shown below:
Common PTP Sync Issues
In nominal mode to deliver egress timestamps to ptp4l, Linux loops back the original packet to the error queue of the listening socket, with the timestamps attached.
However, certain issues might occur under the following circumstances:
GM PTP messages TTL > 1
If the Grand master clock messages have TTL greater than 1, the messages will not be terminated on the boundary clock, but instead be propagated to the slaves. The slaves will directly see the master messages, evaluate it as the best master clock, and attempt to synchronize directly to it. The traffic goes through slow path, which leads to unpredictable path delay; and the slave will be unable to synchronize reasonably close to the master clock.
The issue can be corrected by either of the following ways:
Set up an iptables rule that prevents propagation of PTP packets:
$ iptables -I FORWARD -p udp -m udp --dport 319 -j DROP
$ iptables -I FORWARD -p udp -m udp --dport 320 -j DROP
Another possibility is to have the Grand master clock send packets such that when they arrive to the switch, they have TTL of 1. Such packets are not forwarded. In ptp4l, TTL of sent packets is configured by the udp_ttl option.
Overwhelmed with Ingress PTP Traffic
If a socket is overwhelmed with ingress traffic, there may not be space to enqueue the timestamped egress traffic.
While ptp4l will not notice a missed ingress packet, it needs to wait for the timestamp of the packets that it sent (see tx_timestamp_timeout slave clock ptp4l configuration ), and will therefore notice and complain that the timestamp was not delivered.
Unfortunately, ptp4l does not allow setting of the socket receive buffer size, so if this happens, increase the default value before starting ptp4l, and then revert it. For example:
$ sysctl -w net.core.rmem_max=4194304 # 4MB
$ sysctl -w net.core.rmem_default=4194304
Use Linux perf Event with Intel® Processor Trace
Intel® Processor Trace (Intel® PT) traces program execution (every branch) with low overhead. Intel® PT is supported in Linux perf, which is integrated in the Linux kernel. It can be used through the perf command or through gdb.
Both Intel® Processor Trace enabled Linux perf and Intel® Xed tools Debian packages can be installed from the ECI repository. Setup the ECI repository, then perform either of the following commands to install this component:
- Install from meta-package
$ sudo apt install eci-realtime-benchmarking
- Install from individual Deb package
$ sudo apt install linux-perf xed
Usage
This section is not an exhaustive introduction to the use of Intel® PT, it aims at providing basic commands for creating
perfIntel® PT trace record:
perf record -e intel_pt// ./programRecords a program trace
perf record -e intel_pt// -a sleep 1Records whole system Trace for 1 second
perf record -C 0 -e intel_pt// -a sleep 1Records CPU 0 trace for 1 second
perf record --pid $(pidof program) -e intel_pt//Records an already running program trace
perf record -a -e intel_pt//k sleep 1Records kernel space only trace, complete system
perf record -a -e intel_pt//uRecords user space only trace, complete system
perf record -a -e intel_pt/cyc=1,cyc_thresh=2/ ...Records fine grained timing (needs Skylake/Goldmont, adds more overhead)
perf record -e intel_pt// --filter 'filter main @ /path/to/program' ...Only records main function in program
perf record -e intel_pt// -a --filter 'filter sys_write' programFilters kernel code
perf record -e intel_pt// -a --filter 'start func1 @ program' --filter 'stop func2 @ program' programStarts tracing in program at main and stop tracing at func2Note
Check if Intel® PT is supported and the capabilities that are supported.
# ls /sys/devices/intel_pt/format/
branch  cyc  cyc_thresh  fup_on_ptw  mtc  mtc_period  noretcomp  psb_period  pt  ptw  pwr_evt  tsc
Increase
perfbuffer to limit data lossecho $[100*1024*1024] > /proc/sys/kernel/perf_event_mlock_kb perf record -m 512,100000 -e intel_pt// ...When decoding kernel data, the decoder usually has to run as root:
perf script --ns --itrace=crDecodes program execution and displays function call graph.perf scriptby defaults sampling the data every 100us.
perf script --ns --itrace=i0ns `` Decodes program execution with small *sampling* resolution using ``–itraceoption, example with 10us
perf script --ns --insn-trace --xed -F,+srcline,+srccode,+insn,+time,+sym,+ip,-event,-periodShows every assembly instruction executed with IA64 disassembler.
perf script --ns --itrace=i0ns -F time,sym,srcline,ipShows source lines executed (requires ELF debug symbol)Important
perfhas to save the data to disk. The CPU can execute branches much faster than the disk can keep up, so there will be some data loss for the code that executes many instructions.perfhas no way to slow down the CPU, so when trace bandwidth is greater than disk bandwidth, there will be gaps in the trace. Due to this, it is not a good idea to try to save a long trace, but work with shorter traces. Long traces also take a lot of time to decode.For further information, refer to:
Tracing your Own Code
Compile a simple “Hello World” with debugging information:
#include <stdio.h>

int main()
{
    printf("Hello World!\n");
    return 0;
}
$ gcc -g -o hello hello.c
Set Linux runtime initial conditions to allow seeing kernel symbols (as root):
$ echo 'kernel.kptr_restrict=0' >> /etc/sysctl.conf
$ sysctl -p
$ net.ipv4.conf.default.rp_filter = 1
$ net.ipv4.conf.all.rp_filter = 1
$ kernel.kptr_restrict = 0
Execute
perf recordwith options-eto selectintel_pt/cyc,noretcomp/uevent to get Intel® PT with cycle-accurate mode. Addnoretcompto get a timing information at RET instructions:$ perf record -e intel_pt/cyc,noretcomp/u ./hello Hello World! [ perf record: Woken up 1 times to write data ] [ perf record: Captured and wrote 0.012 MB perf.data ]
The expected
perf scriptdecoded outcome is that an instruction trace be back-annotated from Intel® PT records with source line information and source code:Click to toggle results
            # perf script --ns --insn-trace --xed -F,+srcline,+srccode,+insn,+time,+sym,+ip,-event,-period
         hello 11241 [000] 988748.351134685:      7efc5245c090 [unknown] (/lib/ld-2.28.so)
ld-2.28.so[3391201090]                mov rdi, rsp
         hello 11241 [000] 988748.351134685:      7efc5245c093 [unknown] (/lib/ld-2.28.so)
ld-2.28.so[3391201093]                call 0xdfd <__per_cpu_start+0xdfd>
         hello 11241 [000] 988748.351134685:      7efc5245ce90 [unknown] (/lib/ld-2.28.so)
ld-2.28.so[3391201e90]                push rbp
         hello 11241 [000] 988748.351134685:      7efc5245ce91 [unknown] (/lib/ld-2.28.so)
ld-2.28.so[3391201e91]                mov rbp, rsp
         hello 11241 [000] 988748.351134685:      7efc5245ce94 [unknown] (/lib/ld-2.28.so)
ld-2.28.so[3391201e94]                push r15
         hello 11241 [000] 988748.351134685:      7efc5245ce96 [unknown] (/lib/ld-2.28.so)
ld-2.28.so[3391201e96]                push r14
         hello 11241 [000] 988748.351134685:      7efc5245ce98 [unknown] (/lib/ld-2.28.so)
ld-2.28.so[3391201e98]                push r13
         hello 11241 [000] 988748.351134685:      7efc5245ce9a [unknown] (/lib/ld-2.28.so)
ld-2.28.so[3391201e9a]                push r12
         hello 11241 [000] 988748.351134685:      7efc5245ce9c [unknown] (/lib/ld-2.28.so)
ld-2.28.so[3391201e9c]                mov r12, rdi
         hello 11241 [000] 988748.351134685:      7efc5245ce9f [unknown] (/lib/ld-2.28.so)
ld-2.28.so[3391201e9f]                push rbx
         hello 11241 [000] 988748.351134685:      7efc5245cea0 [unknown] (/lib/ld-2.28.so)
ld-2.28.so[3391201ea0]                sub rsp, 0x38
         hello 11241 [000] 988748.351134685:      7efc5245cea4 [unknown] (/lib/ld-2.28.so)
ld-2.28.so[3391201ea4]                rdtsc
         hello 11241 [000] 988748.351134685:      7efc5245cea6 [unknown] (/lib/ld-2.28.so)
ld-2.28.so[3391201ea6]                mov eax, eax
         hello 11241 [000] 988748.351134685:      7efc5245cea8 [unknown] (/lib/ld-2.28.so)
ld-2.28.so[3391201ea8]                shl rdx, 0x20
         hello 11241 [000] 988748.351134685:      7efc5245ceac [unknown] (/lib/ld-2.28.so)
ld-2.28.so[3391201eac]                or rdx, rax
         hello 11241 [000] 988748.351136900:      7efc5245ceaf [unknown] (/lib/ld-2.28.so)
ld-2.28.so[3391201eaf]                mov rax, qword ptr [rip+0x25f42] <brnf_frag_data_storage+0x3df9>
         hello 11241 [000] 988748.351145066:      7efc5245ceb6 [unknown] (/lib/ld-2.28.so)
ld-2.28.so[3391201eb6]                mov qword ptr [rip+0x257a3] <brnf_frag_data_storage+0x365a>, rdx
         hello 11241 [000] 988748.351145066:      7efc5245cebd [unknown] (/lib/ld-2.28.so)
ld-2.28.so[3391201ebd]                lea rdx, ptr [rip+0x25f34] <brnf_frag_data_storage+0x3deb>
         hello 11241 [000] 988748.351145066:      7efc5245cec4 [unknown] (/lib/ld-2.28.so)
ld-2.28.so[3391201ec4]                mov r14, rdx
Use Wireshark to Dissect OPC UA Pubsub with Time-scheduled Traffic-class
Wireshark has a very large set of plugins to dissect EtherCAT, Profinet, PTP, OPC UA Client/Server, … at packet-level.
Create
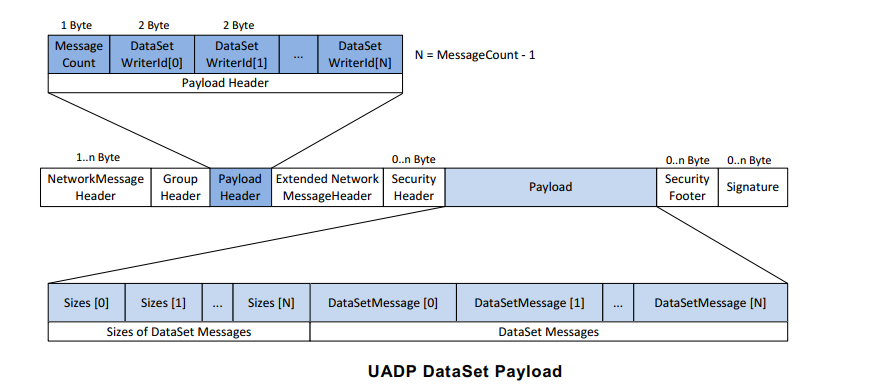
uadp_l2_dissector.luaLUA dissector file to decode UA device UADP ETH (EtherType0xB62C) packet content subject under 802.1Qbv scheduling policy:Click to toggle example script
-- UADP Protocol Dissector for Wireshark -- Author: alexander.mildner@intel.com/florent.pirou@intel.com -- Copyright (C) Intel Germany 2019-2021 uadp_protocol = Proto("UADP", "UADP ETH Protocol") -- Protocol Field definitions according to OPC UA pubsub realtime tutorial. -- Network Message Header version = ProtoField.uint8("uadp.NetworkMessageHeader.version", "version", base.HEX) -- Payload Header msgCount = ProtoField.uint8("uadp.PayloadHeader.msgCount", "messageCount", base.DEC) writerId = ProtoField.uint16("uadp.PayloadHeader.writerId", "writerID", base.DEC) -- Payload Dataset [0] ONLY when msgCount >1 -- size = ProtoField.uint16("uadp.PayloadDataSet0.size", "size", base.DEC) -- Data Set Message [0] Header flags1 = ProtoField.uint8("uadp.DataSetMessage0Header.flags1", "flags1", base.HEX) flags2 = ProtoField.uint8("uadp.DataSetMessage0Header.flags2", "flags2", base.HEX) timestamp = ProtoField.uint64("uadp.DataSetMessage0Header.timestamp", "timestamp", base.DEC) --nstime0 = ProtoField.absolute_time('uadp.DataSetMessage0Header.nstime', 'nstime', base.UTC) majorVersion = ProtoField.uint32("uadp.DataSetMessage0Header.majorVersion", "majorVersion", base.HEX) minorVersion = ProtoField.uint32("uadp.DataSetMessage0Header.minorVersion", "minorVersion", base.HEX) -- Data Set Message [0] Payload servertime = ProtoField.uint64("uadp.DataSetMessage0Payload.servertime", "servertime", base.DEC) -- Data Set Message [0] Payload KPIs --nstime1 = ProtoField.absolute_time('uadp.DataSetMessage0Payload.nstime', 'nstime', base.UTC) epoch1 = ProtoField.string('uadp.DataSetMessage0Payload.pl_epoch', 'pl_epoch') frame_time0 = ProtoField.double('uadp.DataSetMessage0Payload.frame_epoch', 'frame_epoch', base.DEC) diff_time1 = ProtoField.double('uadp.DataSetMessage0Payload.latency1', 'latency1', base.DEC) uadp_protocol.fields = { version, msgCount, writerId, -- size, flags1, flags2, timestamp, -- nstime0, majorVersion, minorVersion, servertime, -- nstime1, epoch1, frame_time0, diff_time1 } local frame_epochtime_f = Field.new("frame.time_epoch") function get_type(offset, buffer) local ua_type_name = "Unknown" local ua_type = buffer(offset, 1):le_uint() if ua_type == 3 then ua_type_name = "UAByte" elseif ua_type == 12 then ua_type_name = "UAString" elseif ua_type == 7 then ua_type_name = "UAUint32" elseif ua_type == 9 then ua_type_name = "UAUint64" elseif ua_type == 5 then ua_type_name = "UAUint16" elseif ua_type == 15 then ua_type_name = "UAByteString" elseif ua_type == 6 then ua_type_name = "UAInt32" end return ua_type_name end function uadp_protocol.dissector(buffer, pinfo, tree) length = buffer:len() if length == 0 then return end pinfo.cols.protocol = uadp_protocol.name local subtree = tree:add(uadp_protocol, buffer(), "UADP ETH Protocol Data") local nwmh = subtree:add("Network Message Header") nwmh:add_le(version, buffer(0,1)) local ph = subtree:add("Payload Header") ph:add_le(msgCount, buffer(1,1)) ph:add_le(writerId, buffer(2,2)) -- local ds0p = subtree:add("Data Set Payload") -- ds0p:add_le(size, buffer(4,2)) local dsm0h = subtree:add("Data Set Message [0] Header") dsm0h:add_le(flags1, buffer(4,1)) dsm0h:add_le(flags2, buffer(5,1)) dsm0h:add_le(timestamp, buffer(6,8)) -- returns a UInt64 object of the microseconds in the Tvb buffer local h_usecs = buffer(6,8):le_nstime() -- gets the seconds as a Lua number local h_secs = ( h_usecs:tonumber() / 1000000 ) -- gets the remainder as a Lua number, in nanoseconds local h_nsecs = ( h_usecs:tonumber() % 1000000 ) * 1000 -- create a NSTime object using the above local h_nstime = NSTime.new(h_secs, h_nsecs) --dsm0h:add_le(nstime0, buffer(6,8 ),h_nstime) dsm0h:add_le(majorVersion, buffer(14,4)) dsm0h:add_le(minorVersion, buffer(18,4)) -- add it to the tree, highlighting the real buffer's bytes, but with the real NSTime value local dsm0p = subtree:add("Data Set Message [0] Payload") dsm0p:add_le(servertime, buffer(25,8)) local dsm0kpi = subtree:add("Data Set Message [0] Payload Info/KPIs") -- returns a UInt64 object of the microseconds in the Tvb buffer local pl_usecs = buffer(25,8):le_nstime() local pl_epoch = buffer(25,8):le_uint64() -- gets the seconds as a Lua number -- ex: 132044265196987430 to epoch 13204426519.6987430 = 0x 01D51D8F41B1A426 local pl_secs = ( pl_usecs:tonumber() / 1000000 ) local pl_secs_epoch = ( pl_epoch / 10000000 ) -- gets the remainder as a Lua number, in nanoseconds local pl_nsecs = ( pl_usecs:tonumber() % 1000000 ) * 1000 local pl_nsecs_epoch = ( pl_epoch % 10000000 ) * 1000 -- create a NSTime object using the above local pl_nstime = NSTime.new(pl_secs, pl_nsecs) local pl_epoch_date = os.date("%x %X", pl_secs_epoch.."."..pl_nsecs_epoch) -- returns a UInt64 object of the microseconds in the Tvb buffer --dsm0kpi:add_le(nstime1, buffer(25,8), pl_nstime) local pinfo_epoch = tonumber(tostring(pinfo.abs_ts)) local pl_epoch1_str = tostring(pl_secs_epoch.."."..pl_nsecs_epoch) --local pl_epoch1_num = tonumber(pl_epoch1_str) - 0x2B6109100 local pl_epoch1_num = tonumber(pl_epoch1_str) dsm0kpi:add_le(epoch1, buffer(25,8), tostring(pl_epoch1_num)) -- 0x11CAAAD0000 -- ex: epoch 1559952919.6984302 to 15599529196984302 = 0x 00376BB06C7317EE local frameepochtime = tonumber(tostring(frame_epochtime_f())) dsm0kpi:add_le(frame_time0, buffer(25,8), frameepochtime) dsm0kpi:add_le(diff_time1, buffer(25,8), frameepochtime - pl_epoch1_num) end local eth_type = DissectorTable.get("ethertype") eth_type:add(0xB62C, uadp_protocol)
In Microsoft Windows, load custom-protocol Dissector to decoded L2 UADP ETH EtherType=
0xB62Cinto Wireshark:Open
%APPDATA%\Wireshark\pluginspaths to your Personal plugin folders.Copy the
uadp_l2_dissector.luafile into the directory
In Linux, load custom-protocol Dissector to decoded L2 UADP ETH EtherType=
0xB62Cinto Wireshark:Open Wireshark and navigate to Help > About Wireshark > Folders.
Find the path to your plugin folders (any of Personal Plugins, Global Plugins, Personal Lua Plugins, Global Lua Plugins will work).
Copy the
uadp_l2_dissector.luafile to the according directory (Note: To copy the files to any of the directories, you need to be a root user).Restart Wireshark.
Note: Make sure, that there are no errors on startup otherwise check readability/accessibility of the script file!
Execute a workload that generates OPC UA traffic.
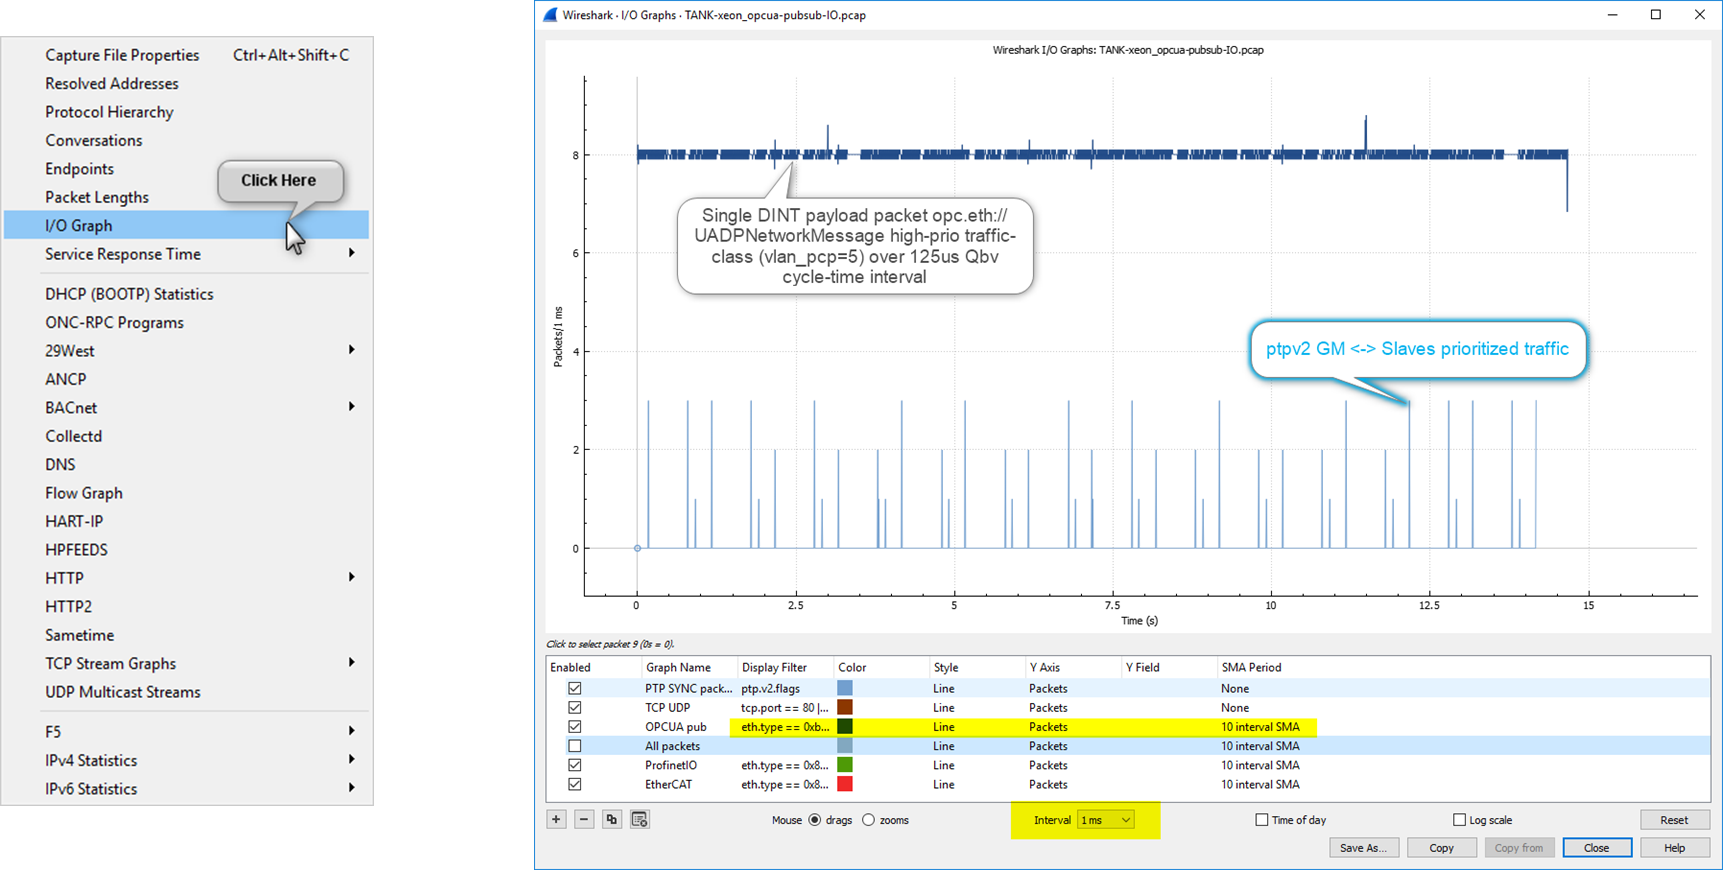
In Wireshark, capture some overly simplistic UADP ETH (
0xB62C) packets, which should be automatically been decoded.In Wireshark, display both PTP and UADP ETH traffic into IO-graph window:
Alternatively, (on headless system) run
tshark -e tmp.pcapcommand-line instead to post-processtcpdumpPCAP and report-out uadp packets fields.$ tshark -X lua_script:uadp_l2_dissector.lua -r tmp.pcap -t e -2 -R uadp.PayloadHeader.writerId==1 \ -E separator=, \ -E header=n \ -Tfields \ -e frame.number \ -e frame.time_epoch \ -e uadp.PayloadHeader.writerId \ -e uadp.DataSetMessage0Payload.pl_epoch \ -e uadp.DataSetMessage0Payload.latency1 > tmp.out
Custom Kernel Boot Parameters
To test custom alternative kernel boot parameters, create or edit the /boot/grub/custom.cfg file:
$ update-grub
Note: Modifying the kernel boot parameters can result in undesired system behavior and should only ever be done with prior knowledge on how it may affect the overall system performance.