Troubleshooting Guide
See also
Visit the Edge Controls for Industrial online support forum for questions and answers: https://community.intel.com/t5/Intel-Edge-Software-Hub/bd-p/edge-software-hub
The techniques presented in this guide can help expose the underlying cause of latency and jitter in real-time applications.
The following section is applicable to:

Monitor CPU Utilization and Affinity
Ensuring that workloads are running isolated on CPUs can be determined by monitoring the state of currently running tasks. One such utility that enables monitoring of task CPU affinity is htop.
htop is an interactive system-monitor process-viewer and process-manager. It is designed as an alternative to the Unix program top. It shows a frequently updated list of the processes running on a computer, normally ordered by the amount of CPU usage. htop provides a full list of processes running, instead of the top resource-consuming processes. htop uses color and gives visual information about processor, swap and memory status.
Run htop with the following command:
$ htop
Additional columns can be added to the output of htop. To configure htop to filter tasks by CPU affinity, follow the steps below:
Press the F2 key to open the menu system
Press the ↓ down arrow key until “Columns” is selected from the “Setup” category
Press the → right arrow key to until the selector moves to the “Available Columns” section
Press the ↓ down arrow key until “PROCESSOR” is selected from the “Available Columns” section
Press the Enter key to add “PROCESSOR” to the “Active Columns” section
Press the F10 key to complete the addition
Press the F6 key to open the “Sort by” menu
Use the ← →↑↓ arrow keys to move the selection to “PROCESSOR”
Press the Enter key to filter tasks by processor affinity
After filtering tasks by CPU affinity, verify that real-time workloads are isolated; real-time workloads should not share a CPU.
Note
Workloads may consist of many individual child tasks. These child tasks are constituent to the workload and it is acceptable and preferred that they run on the same CPU.
Monitor Kernel Interrupts
The Linux kernel is often a source of unwanted interrupts. It is possible to monitor the number of interrupts that occur on a CPU with the following command:
$ watch -n 0.1 cat /proc/interrupts
This command polls the processor every 100 milliseconds and displays interrupt counts. Ideally, isolated CPUs 1, 2, and 3 should not show any interrupt counts incrementing. In practice, the Linux “Local timer interrupt” may still be occurring, but properly prioritized workloads should not be impacted.
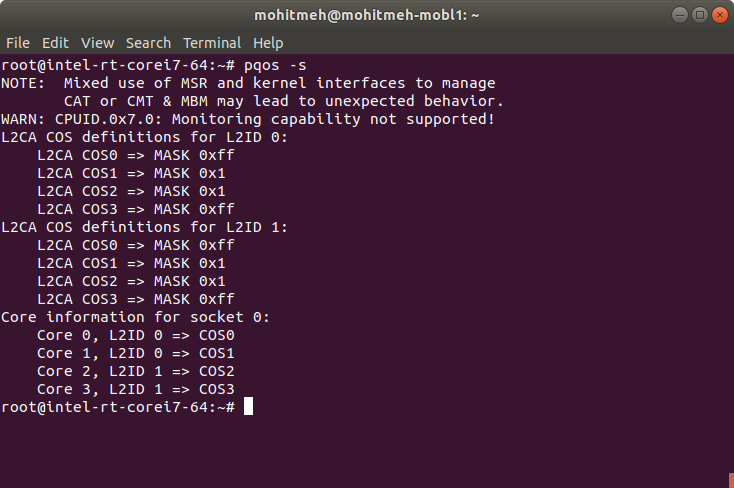
Determine CPU Cache Allocation
Using CAT improperly can have detrimental effects on a real-time workload. It’s important to verify that cache partitioning is properly configured, otherwise increased cache misses may occur.
Use the following command to verify CAT configuration:
$ pqos -s
An example output from a target system utilizing CAT is shown below:
Configure ipv4 and route to Xenomai/RTnet network stack
First, you’ll need to know the MAC addresses of the ports you with to use for real-time ethernet for configuring rteth0 and rteth1
root@eci-intel-8777:~# lspci -v | grep ' Ethernet controller: Intel Corporation I210 Gigabit Network Connection ' -A 15

02:00.0 Ethernet controller: Intel Corporation I210 Gigabit Network Connection (rev 03)
        Subsystem: Intel Corporation I210 Gigabit Network Connection
        Flags: bus master, fast devsel, latency 0, IRQ 23
        Memory at 91200000 (32-bit, non-prefetchable) [size=128K]
        Memory at 91220000 (32-bit, non-prefetchable) [size=16K]
        Capabilities: [40] Power Management version 3
        Capabilities: [50] MSI: Enable- Count=1/1 Maskable+ 64bit+
        Capabilities: [70] MSI-X: Enable+ Count=5 Masked-
        Capabilities: [a0] Express Endpoint, MSI 00
        Capabilities: [100] Advanced Error Reporting
        Capabilities: [1a0] Transaction Processing Hints
        Kernel driver in use: rt_igb
        Kernel modules: igb, rt_igb

03:00.0 Ethernet controller: Intel Corporation I210 Gigabit Network Connection (rev 03)
        Subsystem: Intel Corporation I210 Gigabit Network Connection
        Flags: bus master, fast devsel, latency 0, IRQ 21
        Memory at 91100000 (32-bit, non-prefetchable) [size=128K]
        Memory at 91120000 (32-bit, non-prefetchable) [size=16K]
        Capabilities: [40] Power Management version 3
        Capabilities: [50] MSI: Enable- Count=1/1 Maskable+ 64bit+
        Capabilities: [70] MSI-X: Enable+ Count=5 Masked-
        Capabilities: [a0] Express Endpoint, MSI 00
        Capabilities: [100] Advanced Error Reporting
        Capabilities: [1a0] Transaction Processing Hints
        Kernel driver in use: igb
        Kernel modules: igb, rt_igb
Find out PCI ID of the Intel i210 NIC (igb) on your system and unbind igb Linux driver as following:
$ root@eci-intel-8777:~# lspci -v | grep 'Ethernet controller: Intel Corporation I210 Gigabit Network Connection' | sed 's/^\([0-9a-z]*\:[0-9a-z]*\.[0-9]\).*/\1/'
02:00.0
03:00.0

$ /bin/echo -n 02:00.0 > /sys/bus/pci/drivers/igb/unbind;
now that Linux ethernet kernel module (here igb.ko) being unloaded, now the RTnet kernel modules rt_igb.ko can be loaded.
Note
For the Intel Corporation PRO/1000 PT Quad Port card, you’ll need to make a few changes . First, change the
rt_e1000.ko cards=1,1parameter from 1,1 to 1,1,1,1 to ensure all the ports get turned into RT ports. Then, if you want to add two more ports (rteth2andrteth3), you’d need to add lines in all the places whererteth0andrteth1are set up and taken down. The script below actually only makes use ofrteth0andrteth1but you could always use more if necessary.
The real-time ethernet ports are configured with rtifconfig and assigned IP addresses which are associated with the port MAC addresses.
Below Intel Corporation i210 Adapter ethernet card and use the following version of the script:
insmod /lib/modules/4.19.94-intel-pk-standard/kernel/drivers/xenomai/net/addons/rtcap.ko
insmod /lib/modules/4.19.94-intel-pk-standard/kernel/drivers/xenomai/net/drivers/igb/rt_igb.ko
/usr/sbin/rtifconfig rteth0 up 192.168.1.100 netmask 255.255.255.0 hw ether 00:13:95:34:62:9b
/usr/sbin/rtifconfig
Routes are then added to the routing table with rtroute add in the example below rteth0 handles all routed other than the hands and every slaves and allowing multicast (changed to map 239.0.0.2 to correct mac address) devices. ifconfig is called with the same argument as rtifconfig so that we can access interface information for the RT ports via ifconfig.
/usr/sbin/rtroute add 192.168.1.22 00:13:95:34:62:5B dev rteth0
/usr/sbin/rtroute add 192.168.1.23 00:13:95:34:62:5C dev rteth0
/usr/sbin/rtroute add 192.168.1.24 00:13:95:34:62:5D dev rteth0
/usr/sbin/rtroute add 192.168.1.25 00:13:95:34:62:5E dev rteth0
[...]
/usr/sbin/rtroute add 239.0.0.2 01:00:5e:00:00:02 dev rteth0
/usr/sbin/rtroute

ifconfig rteth0 up 192.168.1.100 netmask 255.255.255.0 hw ether 00:13:95:34:62:9b
Note that first the RT ethernet ports are configured. Note that it may take a little time for the non-RT port to complete DHCP and regain connectivity.
[ 3942.701170] RTnet: registered rteth0
[ 3942.701181] rt_igb 0000:02:00.0: Intel(R) Gigabit Ethernet Network Connection
[ 3942.701187] rt_igb 0000:02:00.0: rteth0: (PCIe:2.5Gb/s:Width x1) 00:13:95:34:62:9b
[ 3942.701193] rt_igb 0000:02:00.0: rteth0: PBA No: FFFFFF-0FF
[ 3942.701198] rt_igb 0000:02:00.0: Using MSI-X interrupts. 1 rx queue(s), 1 tx queue(s)
[48663.868815] RTcap: real-time capturing interface
Note
Very importantly, check that the MAC addresses in the lines preceding “RTnet: registered
rteth0” match those used forrtifconfig(and laterifconfig). If they do not, change them to match (otherwise the association between port name and MAC address will be wrong on the IP layer level and none of your messages will actually get sent). While we assume this in our script above, RTNet doesn’t necessarily chooserteth0to use those interfaces with the two lowest/consecutive MAC addresses!Better use onboard ethernet ports on the target to reach best real time performance. For example: Karbon 700 with Coffee Lake (Refresh) Core-i7.
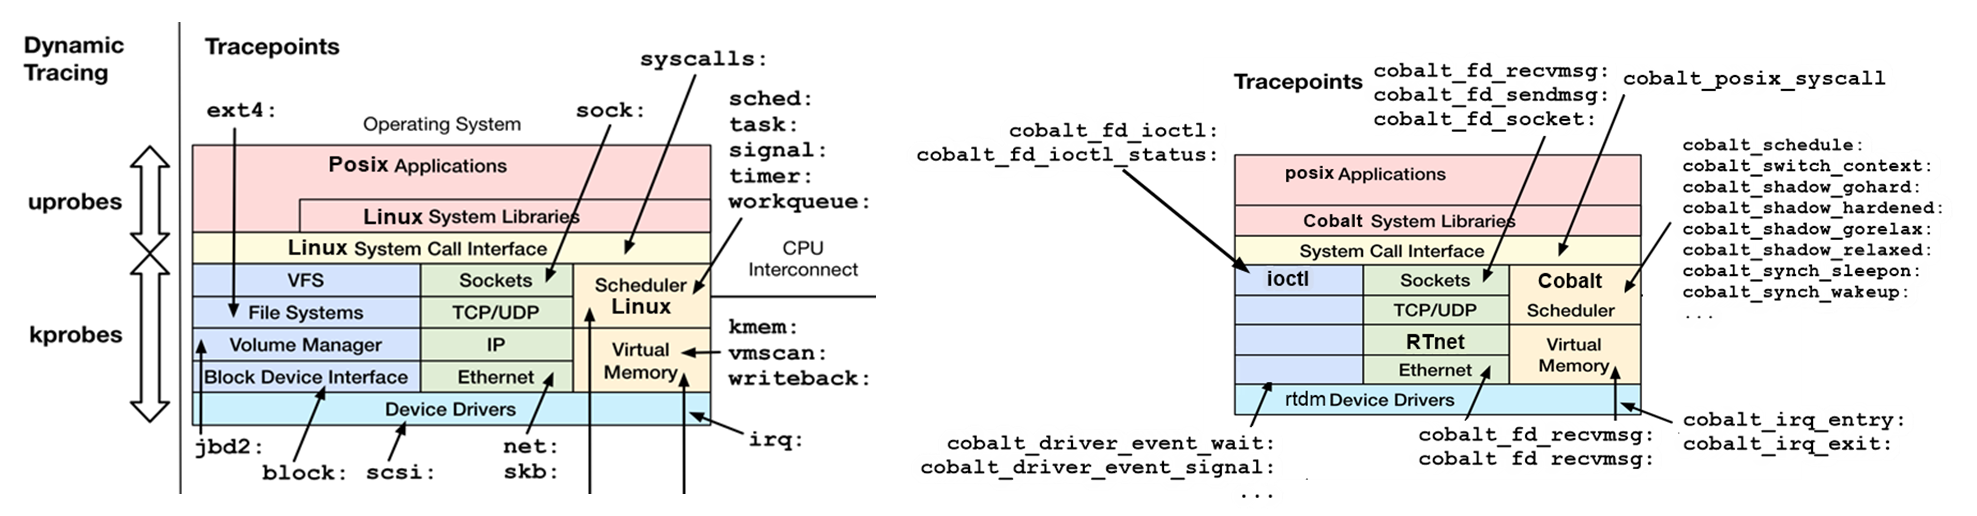
Using Linux events tracing (ftrace) to report latency outliers
Linux real-time communities use best-known-methods to enable trace-event in PREEMPT_RT and XENOMAI/Cobalt OS runtime, also known as tracepoints:
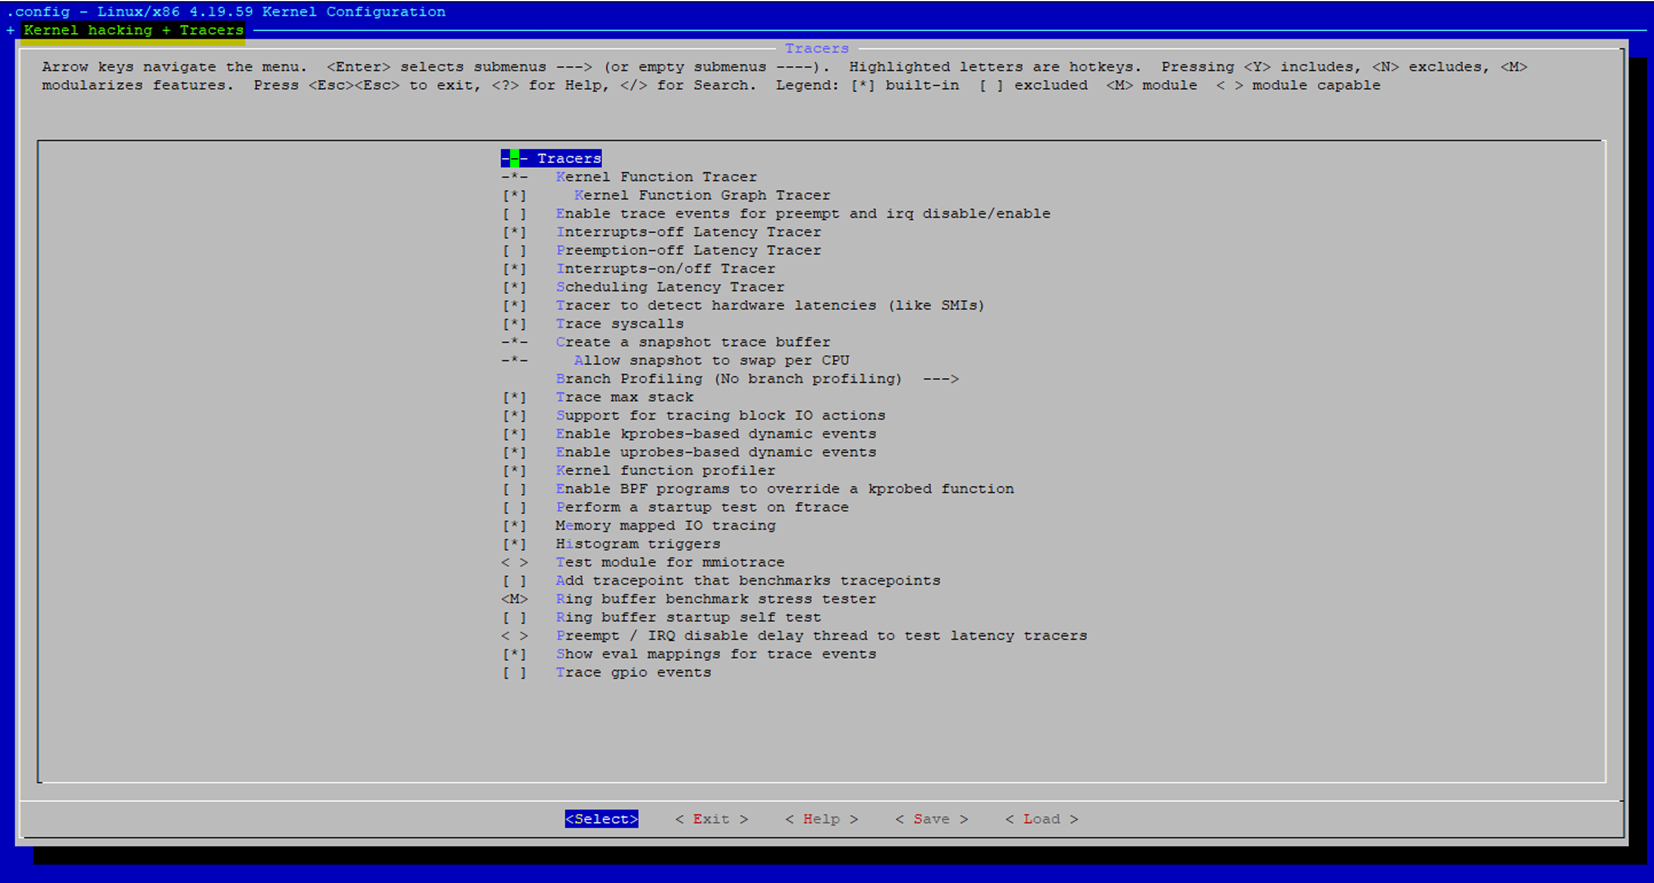
To build a trace-event enabled Linux kernel runtime, certain kernel configurations must be enabled.
Follow the steps from Building ECI for a target of choice and select the option to perform a manual build. Perform all the steps except the final bitbake command. This will setup the target and enable the bitbake server so additional kernel configuration can be performed.

At the terminal, the following command to open the kernel configuration menu:
$ bitbake virtual/kernel -c menuconfig
Note
If you build on a remote server over ssh console,
bitbake virtual/kernel -c menuconfigmight not display anything. To redirect ncurses menu please append the following:$ echo OE_TERMINAL = "screen"' >> conf/local.confUse the kernel configuration menu to enable the following options:
# Add Tracers and Events
CONFIG_TRACING=y
CONFIG_TRACEPOINTS=y
CONFIG_TRACING_SUPPORT=y
CONFIG_HIST_TRIGGERS=y
CONFIG_EVENT_TRACING=y
CONFIG_DYNAMIC_FTRACE=y
CONFIG_FUNCTION_TRACER=y
CONFIG_KPROBE_EVENTS=y
CONFIG_PROBE_EVENTS=y

# Add Kernel Probe
CONFIG_KPROBES=y
CONFIG_JUMP_LABEL=y
CONFIG_KPROBES_ON_FTRACE=y
CONFIG_KRETPROBES=y
CONFIG_USER_RETURN_NOTIFIER=y
CONFIG_HAVE_IOREMAP_PROT=y
CONFIG_HAVE_KPROBES=y
CONFIG_HAVE_KRETPROBES=y
CONFIG_HAVE_KPROBES_ON_FTRACE=y
Clean the kernel and build it with the new options:
$ bitbake -c cleansstate virtual/kernel
$ bitbake -c clean virtual/kernel
$ bitbake virtual/kernel
Build the entire ECI image as normal to incorporate the new kernel.
#. After booting with the new kernel, the Linux Thread scheduler and interrupts trace events can be enabled as followed :
echo 1 > /sys/kernel/debug/tracing/events/sched/sched_switch/enable
echo 1 > /sys/kernel/debug/tracing/events/sched/sched_wakeup/enable
echo 1 > /sys/kernel/debug/tracing/events/power/cpu_idle/enable
echo 1 > /sys/kernel/debug/tracing/events/power/cpu_frequency/enable
echo 1 > /sys/kernel/debug/tracing/events/power/clock_set_rate/enable
echo 1 > /sys/kernel/debug/tracing/events/workqueue/enable
echo 1 > /sys/kernel/debug/tracing/events/irq/enable
echo 1 > /sys/kernel/debug/tracing/events/nmi/enable
echo 100000 > /sys/kernel/debug/tracing/buffer_size_kb
echo 1 > /sys/kernel/debug/tracing/options/record-tgid
echo 0 > /sys/kernel/debug/tracing/options/overwrite
echo global > /sys/kernel/debug/tracing/trace_clock
To Flush & start tracing again :
echo > /sys/kernel/debug/tracing/trace
echo 1 > /sys/kernel/debug/tracing/tracing_on
To Stop tracing then redirect stdout trace buffer to a temporary file
echo 0 > /sys/kernel/debug/tracing/tracing_on
cat /sys/kernel/debug/tracing/trace > /tmp/trace.txt

_Load_ (or drag-n-drop)
trace.txtfile in the HTML timeviewer for a deep-dive analysis!
Note
please use Google Chrome/Chromium or Microsoft Edge. Firefox may be very slow. Microsoft IE browser is not compatible. Others browsers Opera/Safari/… were never tried.
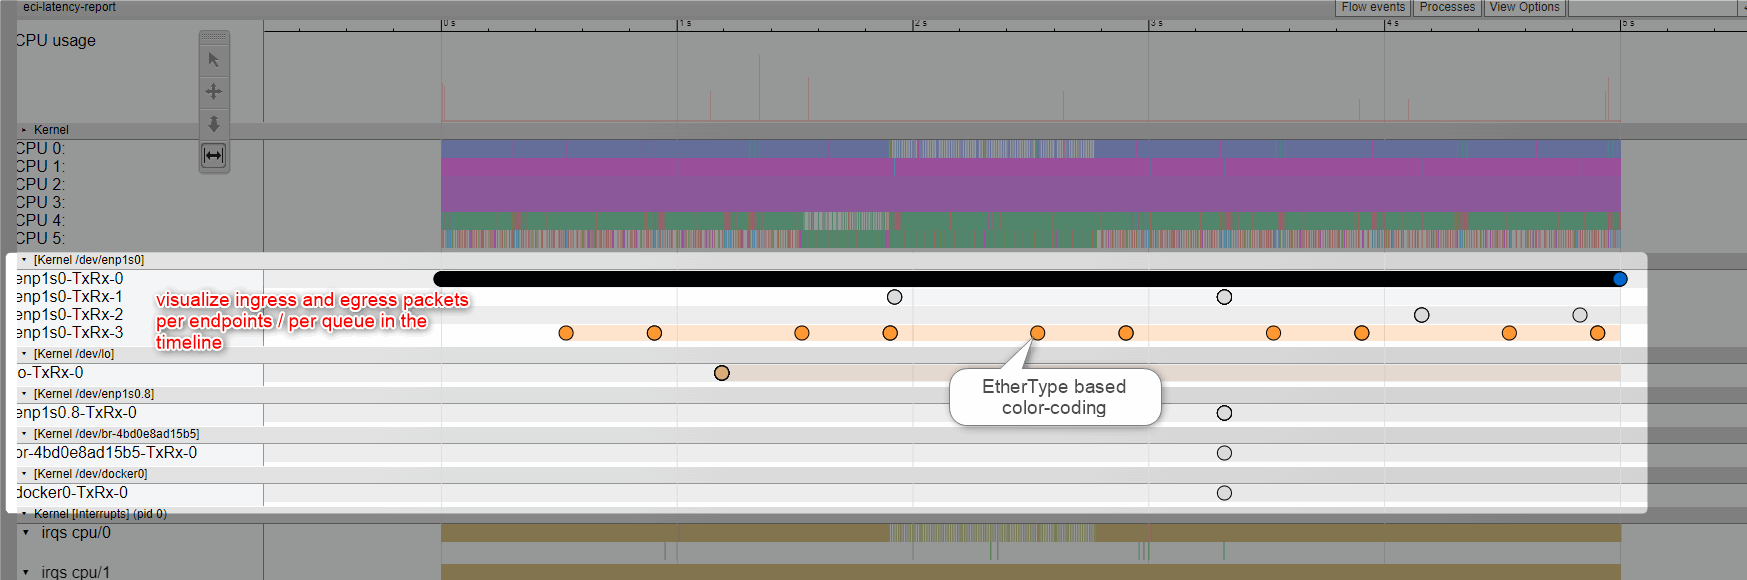
Create a af_packet Ftrace System level timeview user-report
Find below Linux system-level trace events relevant for recording Ethernet TSN context :
echo 1 > /sys/kernel/debug/tracing/events/net/net_dev_start_xmit/enable
echo 1 > /sys/kernel/debug/tracing/events/net/net_dev_xmit/enable
echo 1 > /sys/kernel/debug/tracing/events/net/net_dev_queue/enable
echo 1 > /sys/kernel/debug/tracing/events/net/net_dev_xmit_timeout/enable
echo 1 > /sys/kernel/debug/tracing/events/net/netif_rx_ni_entry/enable
echo 1 > /sys/kernel/debug/tracing/events/net/netif_rx_ni_exit/enable
echo 1 > /sys/kernel/debug/tracing/events/net/netif_rx_entry/enable
echo 1 > /sys/kernel/debug/tracing/events/net/netif_rx_exit/enable
echo 1 > /sys/kernel/debug/tracing/events/sched/sched_switch/enable
echo 1 > /sys/kernel/debug/tracing/events/sched/sched_wakeup/enable
echo 1 > /sys/kernel/debug/tracing/events/power/cpu_idle/enable
echo 1 > /sys/kernel/debug/tracing/events/power/cpu_frequency/enable
echo 1 > /sys/kernel/debug/tracing/events/power/clock_set_rate/enable
echo 1 > /sys/kernel/debug/tracing/events/workqueue/enable
echo 1 > /sys/kernel/debug/tracing/events/irq/enable
echo 100000 > /sys/kernel/debug/tracing/buffer_size_kb
echo 1 > /sys/kernel/debug/tracing/options/record-tgid
echo 0 > /sys/kernel/debug/tracing/options/overwrite
echo global > /sys/kernel/debug/tracing/trace_clock
To Flush & start tracing :
echo > /sys/kernel/debug/tracing/trace
echo 1 > /sys/kernel/debug/tracing/tracing_on
To Stop tracing then redirect stdout trace buffer to a temporary file
echo 0 > /sys/kernel/debug/tracing/tracing_on
cat /sys/kernel/debug/tracing/trace > /tmp/trace.txt
To _Load_ (or drag-n-drop)
trace.txtfile in the HTML timeviewer for a deep-dive analysis!
Note
please use Google Chrome/Chromium or Microsoft Edge. Firefox may be very slow. Microsoft IE browser is not compatible. Others browsers Opera/Safari/… were never tried.
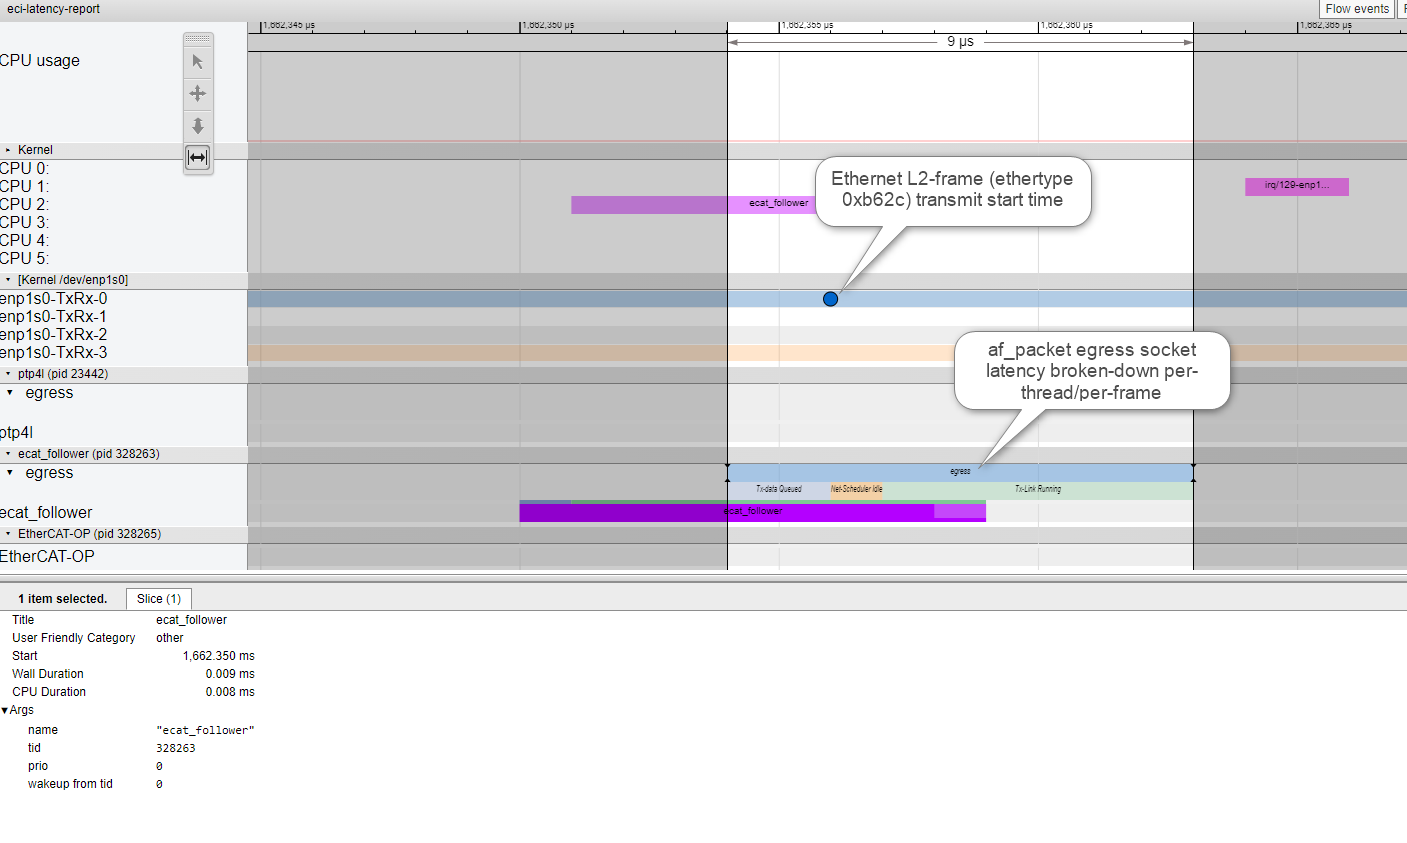
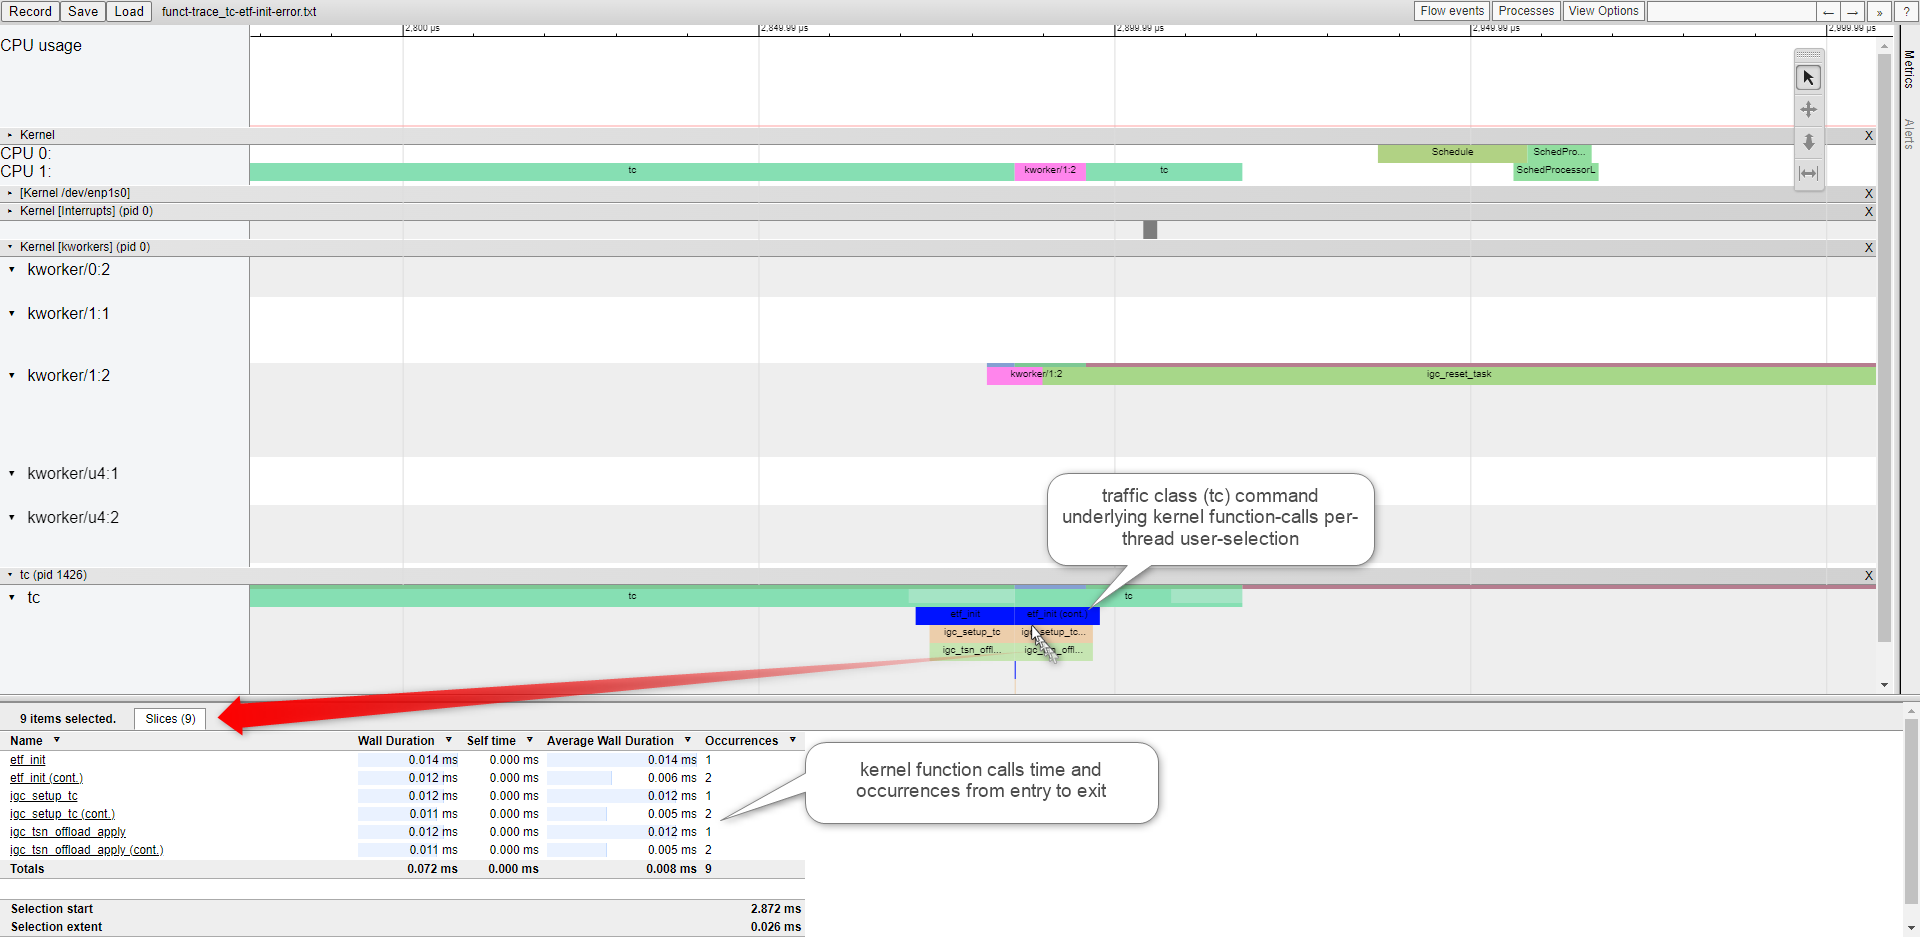
Create a af_packet Ftrace System & Functional level timeview user-report
Find below Linux system-level trace events relevant for recording Ethernet TSN context :
echo 1 > /sys/kernel/debug/tracing/events/net/net_dev_start_xmit/enable
echo 1 > /sys/kernel/debug/tracing/events/net/net_dev_xmit/enable
echo 1 > /sys/kernel/debug/tracing/events/net/net_dev_queue/enable
echo 1 > /sys/kernel/debug/tracing/events/net/net_dev_xmit_timeout/enable
echo 1 > /sys/kernel/debug/tracing/events/net/netif_rx_ni_entry/enable
echo 1 > /sys/kernel/debug/tracing/events/net/netif_rx_ni_exit/enable
echo 1 > /sys/kernel/debug/tracing/events/net/netif_rx_entry/enable
echo 1 > /sys/kernel/debug/tracing/events/net/netif_rx_exit/enable
echo 1 > /sys/kernel/debug/tracing/events/sched/sched_switch/enable
echo 1 > /sys/kernel/debug/tracing/events/sched/sched_wakeup/enable
echo 1 > /sys/kernel/debug/tracing/events/power/cpu_idle/enable
echo 1 > /sys/kernel/debug/tracing/events/power/cpu_frequency/enable
echo 1 > /sys/kernel/debug/tracing/events/power/clock_set_rate/enable
echo 1 > /sys/kernel/debug/tracing/events/workqueue/enable
echo 1 > /sys/kernel/debug/tracing/events/irq/enable
echo 100000 > /sys/kernel/debug/tracing/buffer_size_kb
echo 1 > /sys/kernel/debug/tracing/options/record-tgid
echo 0 > /sys/kernel/debug/tracing/options/overwrite
echo global > /sys/kernel/debug/tracing/trace_clock
Find below Linux kernel function events configured in funcgraph-flat and relevant for recording Ethernet TSN context :
echo 0 > /sys/kernel/debug/tracing/tracing_on
echo 1 > /sys/kernel/debug/tracing/options/funcgraph-abstime
echo 1 > /sys/kernel/debug/tracing/options/funcgraph-cpu
echo 1 > /sys/kernel/debug/tracing/options/funcgraph-proc
echo 1 > /sys/kernel/debug/tracing/options/funcgraph-flat
Optionally, Enable ETF relevant available_filter_functions
echo "etf_reset" > /sys/kernel/debug/tracing/set_ftrace_filter
echo "etf_enqueue_timesortedlist" >> /sys/kernel/debug/tracing/set_ftrace_filter
echo "etf_peek_timesortedlist" >> /sys/kernel/debug/tracing/set_ftrace_filter
echo "etf_dequeue_timesortedlist" >> /sys/kernel/debug/tracing/set_ftrace_filter
echo "etf_init" >> /sys/kernel/debug/tracing/set_ftrace_filter
echo "etf_reset" >> /sys/kernel/debug/tracing/set_ftrace_filter
echo "etf_destroy" >> /sys/kernel/debug/tracing/set_ftrace_filter
echo "etf_dump" >> /sys/kernel/debug/tracing/set_ftrace_filter
Optionally, Enable TAPRIO relevant available_filter_functions
echo "taprio_reset" >> /sys/kernel/debug/tracing/set_ftrace_filter
echo "taprio_enqueue" >> /sys/kernel/debug/tracing/set_ftrace_filter
echo "taprio_peek" >> /sys/kernel/debug/tracing/set_ftrace_filter
echo "taprio_peek_offload" >> /sys/kernel/debug/tracing/set_ftrace_filter
echo "taprio_peek_soft" >> /sys/kernel/debug/tracing/set_ftrace_filter
echo "taprio_dequeue" >> /sys/kernel/debug/tracing/set_ftrace_filter
echo "taprio_dequeue_offload" >> /sys/kernel/debug/tracing/set_ftrace_filter
echo "taprio_dequeue_soft" >> /sys/kernel/debug/tracing/set_ftrace_filter
echo "taprio_walk" >> /sys/kernel/debug/tracing/set_ftrace_filter
echo "taprio_change" >> /sys/kernel/debug/tracing/set_ftrace_filter
echo "taprio_destroy" >> /sys/kernel/debug/tracing/set_ftrace_filter
echo "taprio_dump" >> /sys/kernel/debug/tracing/set_ftrace_filter
echo "taprio_init" >> /sys/kernel/debug/tracing/set_ftrace_filter
Optionally, Enable I225 relevant available_filter_functions
echo "igc_setup_tc" >> /sys/kernel/debug/tracing/set_ftrace_filter
echo "igc_reset" >> /sys/kernel/debug/tracing/set_ftrace_filter
echo "igc_tsn_new_flags" >> /sys/kernel/debug/tracing/set_ftrace_filter
echo "igc_tsn_enable_offload" >> /sys/kernel/debug/tracing/set_ftrace_filter
echo "igc_tsn_offload_apply" >> /sys/kernel/debug/tracing/set_ftrace_filter
echo "igc_ptp_tx_hang" >> /sys/kernel/debug/tracing/set_ftrace_filter
echo "igc_ptp_rx_pktstamp" >> /sys/kernel/debug/tracing/set_ftrace_filter
echo "igc_ptp_suspend" >> /sys/kernel/debug/tracing/set_ftrace_filter
echo "igc_ptp_reset" >> /sys/kernel/debug/tracing/set_ftrace_filter
echo "igc_ptp_read" >> /sys/kernel/debug/tracing/set_ftrace_filter
echo "igc_ptp_init" >> /sys/kernel/debug/tracing/set_ftrace_filter
echo "igc_ptp_stop" >> /sys/kernel/debug/tracing/set_ftrace_filter
Optionally Enable I210 relevant available_filter_functions
echo "igb_reset" >> /sys/kernel/debug/tracing/set_ftrace_filter
echo "igb_tx_timeout" >> /sys/kernel/debug/tracing/set_ftrace_filter
echo "igb_config_tx_modes" >> /sys/kernel/debug/tracing/set_ftrace_filter
echo "igb_ptp_settime_i210"  >> /sys/kernel/debug/tracing/set_ftrace_filter
echo "igb_ptp_feature_enable"  >> /sys/kernel/debug/tracing/set_ftrace_filter
echo "igb_ptp_verify_pin"  >> /sys/kernel/debug/tracing/set_ftrace_filter
echo "igb_ptp_set_timestamp_mode"  >> /sys/kernel/debug/tracing/set_ftrace_filter
echo "igb_ptp_overflow_check"  >> /sys/kernel/debug/tracing/set_ftrace_filter
echo "igb_ptp_feature_enable_i210"  >> /sys/kernel/debug/tracing/set_ftrace_filter
echo "igb_ptp_gettimex_i210"  >> /sys/kernel/debug/tracing/set_ftrace_filter
echo "igb_ptp_adjtime_i210"  >> /sys/kernel/debug/tracing/set_ftrace_filter
echo "igb_ptp_systim_to_hwtstamp"  >> /sys/kernel/debug/tracing/set_ftrace_filter
echo "igb_ptp_tx_work"  >> /sys/kernel/debug/tracing/set_ftrace_filter
echo "igb_ptp_rx_hang"  >> /sys/kernel/debug/tracing/set_ftrace_filter
echo "igb_ptp_tx_hang"  >> /sys/kernel/debug/tracing/set_ftrace_filter
echo "igb_ptp_rx_pktstamp"  >> /sys/kernel/debug/tracing/set_ftrace_filter
echo "igb_ptp_rx_rgtstamp"  >> /sys/kernel/debug/tracing/set_ftrace_filter
echo "igb_ptp_get_ts_config"  >> /sys/kernel/debug/tracing/set_ftrace_filter
echo "igb_ptp_set_ts_config"  >> /sys/kernel/debug/tracing/set_ftrace_filter
echo "igb_ptp_suspend"  >> /sys/kernel/debug/tracing/set_ftrace_filter
echo "igb_ptp_stop"  >> /sys/kernel/debug/tracing/set_ftrace_filter
echo "igb_ptp_reset"  >> /sys/kernel/debug/tracing/set_ftrace_filter
echo "igb_ptp_init"  >> /sys/kernel/debug/tracing/set_ftrace_filter
To Enable function_graph as current tracer
cat /sys/kernel/debug/tracing/set_ftrace_filter
echo function-trace > /sys/kernel/debug/tracing/trace_options
echo function_graph >  /sys/kernel/debug/tracing/current_tracer
To Flush & start Start tracing
echo > /sys/kernel/debug/tracing/trace
echo 1 > /sys/kernel/debug/tracing/tracing_on
To Stop tracing after upon and stdout trace buffer to file
echo 0 > /sys/kernel/debug/tracing/tracing_on
cat /sys/kernel/debug/tracing/trace > /tmp/func-trace.txt
_Load_ (or drag-n-drop)
func-trace.txtfile in the HTML timeviewer for a deep-dive analysis!
Note
please use Google Chrome/Chromium or Microsoft Edge. Firefox may be very slow. Microsoft IE browser is not compatible. Others browsers Opera/Safari/… were never tried.
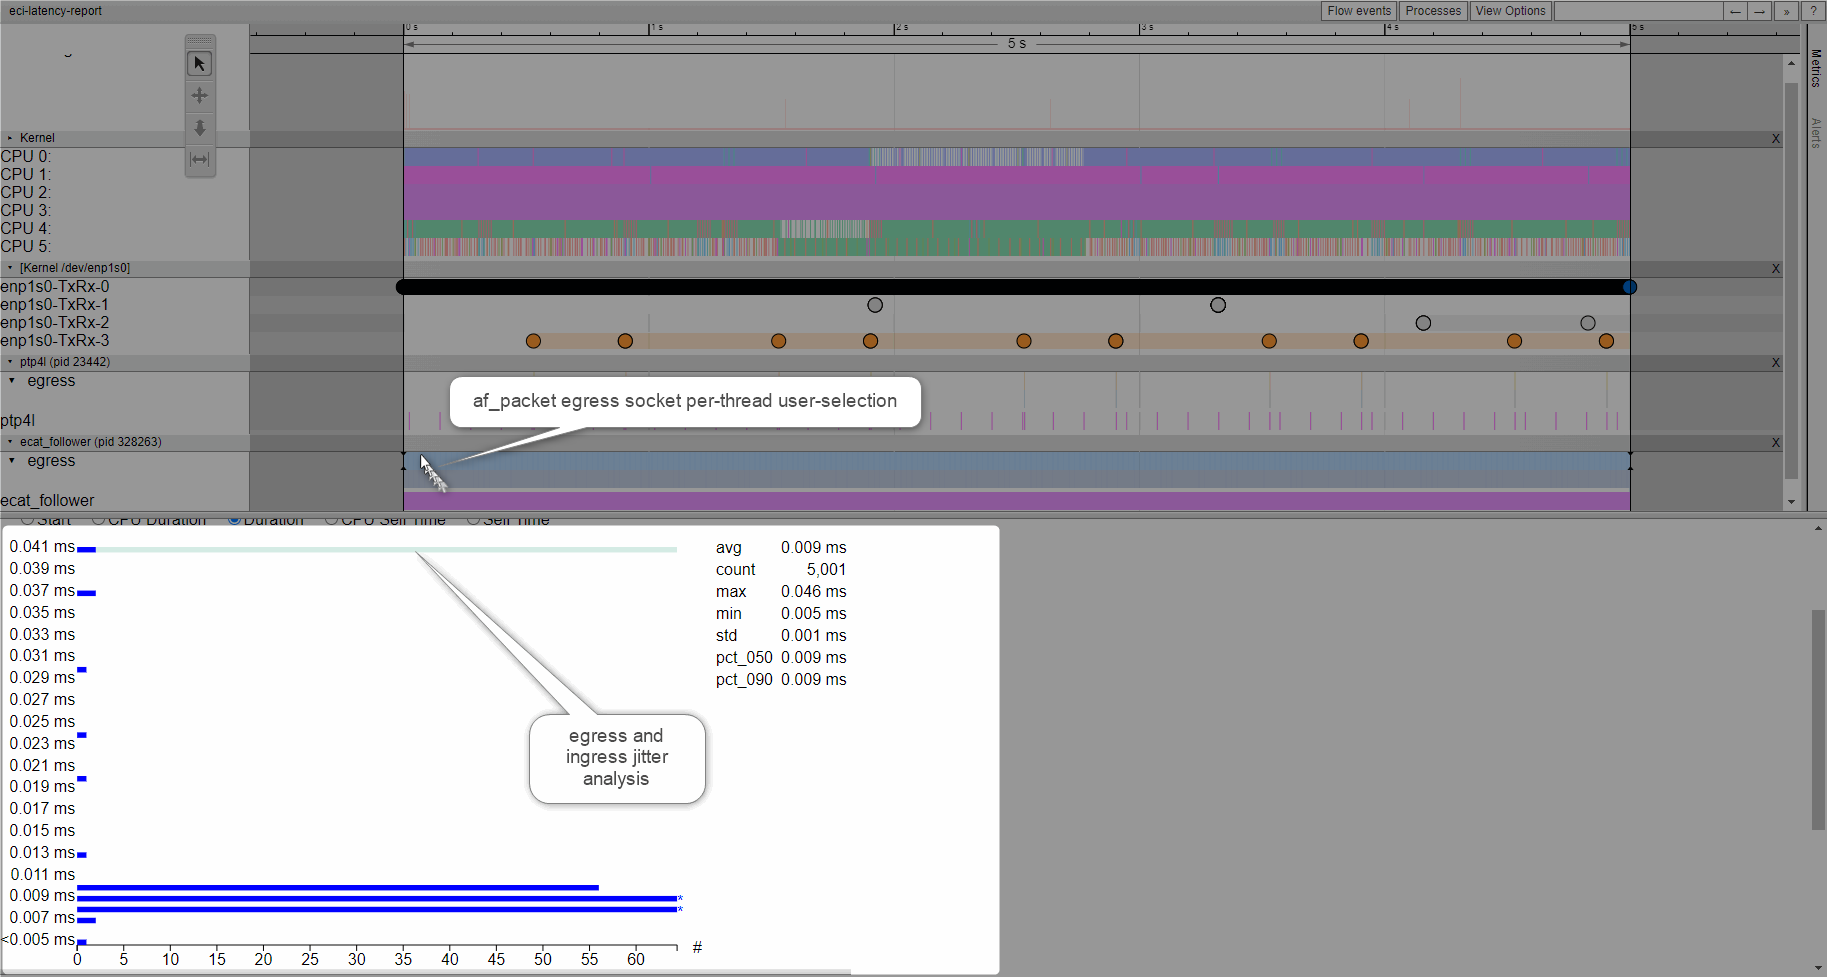
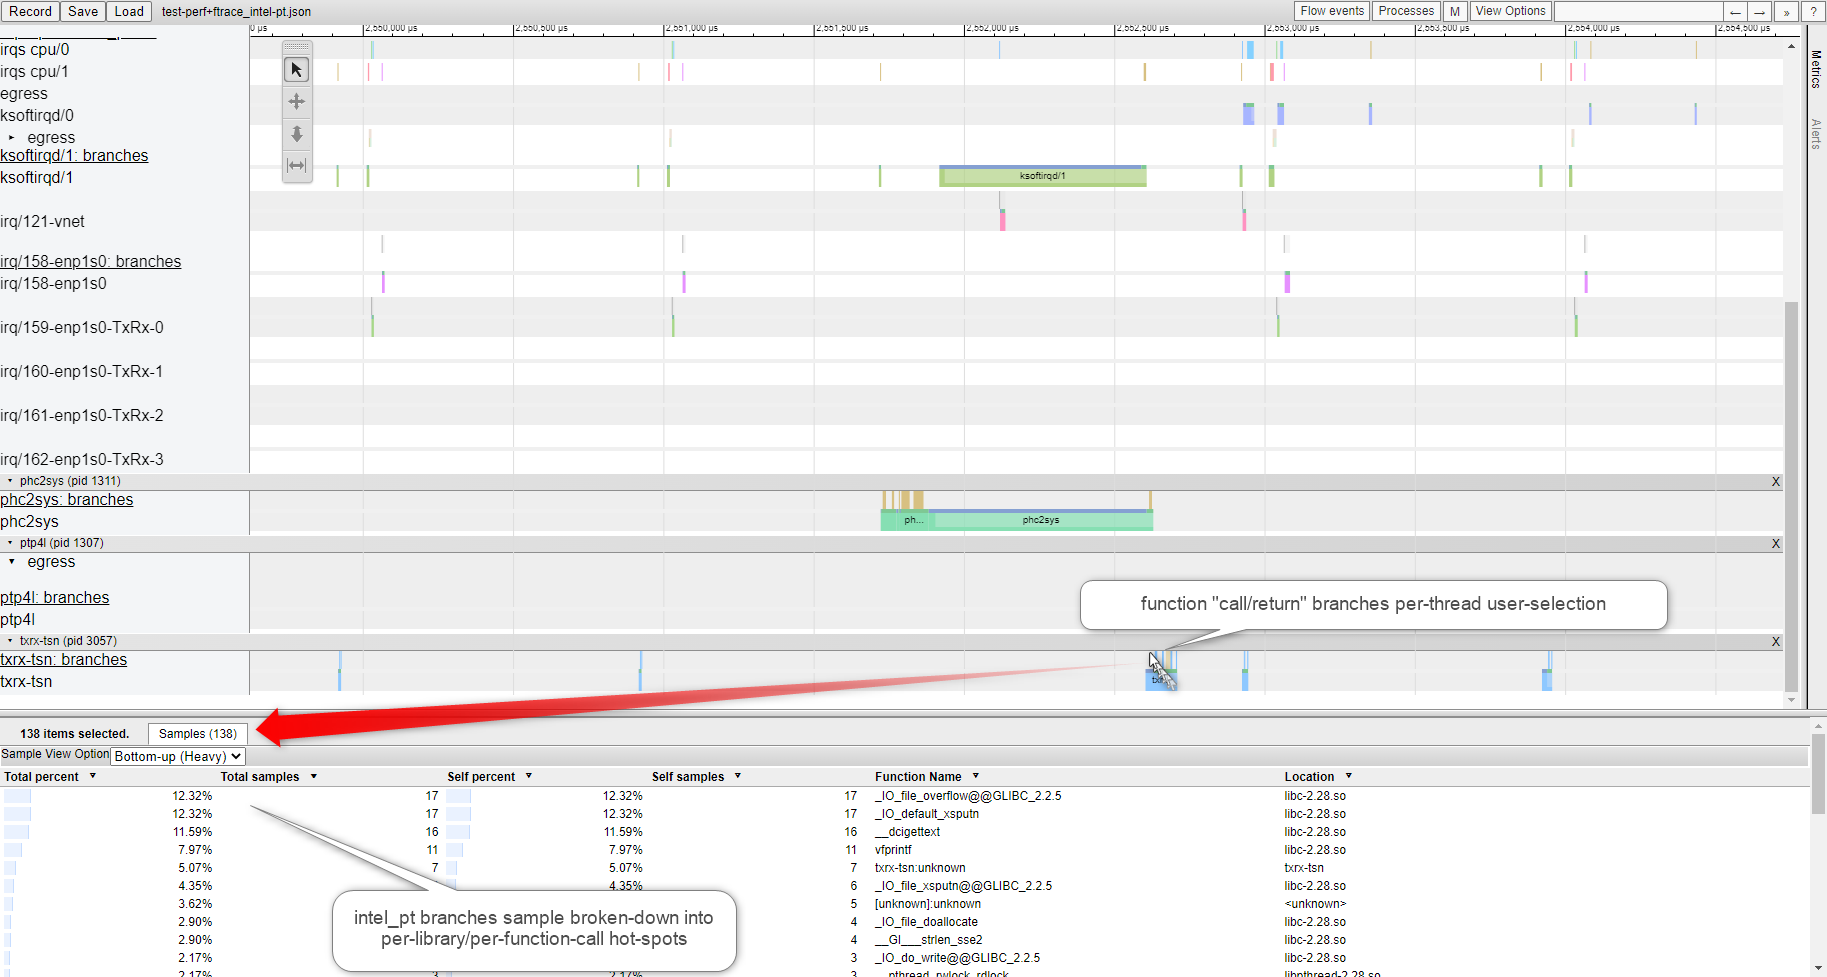
Create Linux af_packet Ftrace + Perf/Intel_pt combined timeview user-report
See section Use Linux Perf event with Intel® Processor Trace for more details and options on
Find below Linux system-level from both ftrace and perf/intel_pt events relevant for recording Ethernet TSN context during 1-second :
echo > /sys/kernel/debug/tracing/trace && \
echo 1 > /sys/kernel/debug/tracing/tracing_on && \
perf record -e '{intel_pt//}' -a sleep 1 && \
echo 0 > /sys/kernel/debug/tracing/tracing_on
Generate a catapult timeviewer Json-format file, including current ftrace+perf (Intel PT) events user-records”
perf script \
--kallsym kallsym.log --ns --itrace=crxwp \
-s /usr/shared/catapult/catapult_ftrace-perf.py -- \
-t -f json -o /tmp/perf+ftrace_intel-pt.json
Generate an catapult timeviewer Json-format, from offline ftrace+perf (Intel PT) events user-records”
cat /sys/kernel/debug/tracing/trace > /tmp/trace.txt
perf script -i perf.data \
--kallsym kallsym.log --ns --itrace=crxwp \
-s /usr/shared/catapult/catapult_ftrace-perf.py -- \
--input /tmp/trace.txt -t -f json \
-o /tmp/perf+ftrace_intel-pt.json
_Load_ (or drag-n-drop)
perf+ftrace_intel-pt.jsonfile in the HTML timeviewer for a deep-dive analysis!Or open directly the offline
perf+ftrace_intel-pt.htmlgenerated timeviewer HTML report, containing ftrace+perf (Intel PT) compressed user-records”
perf script -i perf.data \
--kallsym kallsym.log --ns --itrace=crxwp \
-s /usr/shared/catapult/catapult_ftrace-perf.py -- \
--input /tmp/trace.txt -t -f html \
-o /tmp/perf+ftrace_intel-pt.html
Note
please use Google Chrome/Chromium or Microsoft Edge. Firefox may be very slow. Microsoft IE browser is not compatible. Others browsers Opera/Safari/… were never tried.
Create Linux Ftrace af_packet latency histogram Text-UI user-report
You can choose to troubleshooting _netdev_ Ethernet device HW-SW overhead in Text-UI (TUI)
echo 1 > /sys/kernel/debug/tracing/events/net/net_dev_start_xmit/enable
echo 1 > /sys/kernel/debug/tracing/events/net/net_dev_xmit/enable
echo 1 > /sys/kernel/debug/tracing/events/net/net_dev_queue/enable
echo 1 > /sys/kernel/debug/tracing/events/net/net_dev_xmit_timeout/enable
echo 1 > /sys/kernel/debug/tracing/events/net/netif_rx_ni_entry/enable
echo 1 > /sys/kernel/debug/tracing/events/net/netif_rx_ni_exit/enable
echo 1 > /sys/kernel/debug/tracing/events/net/netif_rx_entry/enable
echo 1 > /sys/kernel/debug/tracing/events/net/netif_rx_exit/enable
Using runtime synthetic trace-event in combination with hist:keys trigger it becomes possible to record into a time-variable every af_packet sendmsg() calls by any sample-app-tapr thread (pid)
Filter all functions but
packet_sendmsgand probe event entry and return :Add one dynamic event (kprobe) at the entry of
packet_sendmsg()Add one dynamic event at the return of
`packet_sendmsg()
$ echo 0 >/sys/kernel/debug/tracing/tracing_on
$ echo >/sys/kernel/debug/tracing/trace > /dev/null
$ echo "nop" >/sys/kernel/debug/tracing/current_tracer > /dev/null
$ echo "packet_sendmsg" >/sys/kernel/debug/tracing/set_ftrace_filter
$ perf probe packet_sendmsg
$ perf probe -f packet_sendmsg%return
Create a synthetic_event ->
packet_sendmsg_latency(int pid, u64 latency)Configure the trigger on the function
packet_sendmsg()call entry event, collecting the timestamp in usecsConfigure the trigger on the function
packet_sendmsg()call return event, calculating the latency
$ echo 'packet_sendmsg_latency int pid; u64 lat' > /sys/kernel/debug/tracing/synthetic_events
$ echo 'hist:keys=common_pid:ts0=common_timestamp.usecs if comm=="sample-app-tapr"' \
    >/sys/kernel/debug/tracing/events/probe/packet_sendmsg/trigger
$ echo 'hist:keys=common_pid:sendmsg_latency=common_timestamp.usecs-$ts0:onmatch(probe.packet_sendmsg).packet_sendmsg_latency(common_pid,$sendmsg_latency) if comm=="sample-app-tapr"' \
    > /sys/kernel/debug/tracing/events/probe/packet_sendmsg__return/trigger
$ echo 'hist:keys=lat:sort=lat'> /sys/kernel/debug/tracing/events/synthetic/packet_sendmsg_latency/trigger
Run the sample-app-taprio application with tracing enabled and report af_packet transfer
synthetic_eventas latency histogram$ cd /opt/intel/iotg_tsn_ref_sw/sample-app-taprio/ $ echo 1 > /sys/kernel/debug/tracing/tracing_on $ taskset -c 1 chrt -f 99 ./sample-app-taprio -i ${interface_name} -c $RX_IP_ADDR -x 1 -w tsn_prio3-s1s2s3.cfg -b ${base_time} -z 600000 -e 50000 & $ echo 0 > /sys/kernel/debug/tracing/tracing_on $ cat /sys/kernel/debug/tracing/events/synthetic/packet_sendmsg_latency/hist
Example output
# event histogram
#
# trigger info: hist:keys=pid,lat:vals=hitcount:sort=pid,lat:size=2048 [active]
#

{ pid:       1875, lat:          6 } hitcount:          1
{ pid:       1875, lat:          7 } hitcount:          2
{ pid:       1875, lat:         10 } hitcount:          3
{ pid:       1875, lat:         11 } hitcount:       4239
{ pid:       1875, lat:         12 } hitcount:      13782
{ pid:       1875, lat:         13 } hitcount:       1282
{ pid:       1875, lat:         14 } hitcount:        706
{ pid:       1875, lat:         15 } hitcount:         54
{ pid:       1875, lat:         16 } hitcount:         12
{ pid:       1875, lat:         17 } hitcount:         15
{ pid:       1875, lat:         18 } hitcount:         13
{ pid:       1875, lat:         19 } hitcount:          4
{ pid:       1875, lat:         20 } hitcount:          5
{ pid:       1875, lat:         21 } hitcount:          6
{ pid:       1875, lat:         22 } hitcount:          3
{ pid:       1875, lat:         23 } hitcount:          4
{ pid:       1875, lat:         24 } hitcount:          3
{ pid:       1875, lat:         25 } hitcount:          5
{ pid:       1875, lat:         26 } hitcount:          4
{ pid:       1875, lat:         27 } hitcount:          1
{ pid:       1875, lat:         28 } hitcount:          2
{ pid:       1875, lat:         29 } hitcount:          1
{ pid:       1875, lat:         30 } hitcount:          1

Totals:
    Hits: 20149
    Entries: 23
    Dropped: 0
Create Linux Ftrace Inter-event af_packet latency histogram Text-UI user-report
This time we use synthetic trace-event in combination with af_packet sendmsg() function call and pre-defined network events to break down the overall latency of af_packet sendmsg() across kernel network events.
Filter all functions but
packet_sendmsgand probe event entry and return :Add one dynamic event (kprobe) at the entry of
packet_sendmsg()Add one dynamic event at the return of
`packet_sendmsg()
$ echo 0 >/sys/kernel/debug/tracing/tracing_on
$ echo >/sys/kernel/debug/tracing/trace > /dev/null
$ echo "nop" >/sys/kernel/debug/tracing/current_tracer > /dev/null
$ echo "packet_sendmsg" >/sys/kernel/debug/tracing/set_ftrace_filter
$ perf probe packet_sendmsg
$ perf probe -f packet_sendmsg%return
Create a synthetic_event ->
latency(int pid, u64 latency)for function call(packet_sendmsg) and kernel network events(net_dev_queue, net_dev_start_xmit and net_dev_xmit)Configure the trigger on the function
packet_sendmsg()call entry event, collecting the timestamp in usecsConfigure the trigger on the kernel network events
net_dev_queue,net_dev_start_xmitandnet_dev_xmitevents, calculating the latency
$ echo 'packet_sendmsg_latency int pid; u64 lat;' >> /sys/kernel/debug/tracing/synthetic_events
$ echo 'net_proto_latency int pid; u64 lat;' >> /sys/kernel/debug/tracing/synthetic_events
$ echo 'net_startxmit_latency int pid; u64 lat;' >> /sys/kernel/debug/tracing/synthetic_events
$ echo 'net_xmit_latency int pid; u64 lat;' >> /sys/kernel/debug/tracing/synthetic_events

$ echo 'hist:keys=common_pid:ts0=common_timestamp.usecs if comm=="sample-app-tapr"' >> /sys/kernel/debug/tracing /events/probe/packet_sendmsg/trigger

$ echo 'hist:keys=common_pid:ts1=common_timestamp.usecs:proto_latency=common_timestamp.usecs-$ts0:onmatch(probe.packet_sendmsg).net_proto_latency(common_pid,$proto_latency) if comm=="sample-app-tapr"'' >> \
    /sys/kernel/debug/tracing/events/net/net_dev_queue/trigger
$ echo 'hist:keys=common_pid:ts2=common_timestamp.usecs:startxmit_latency=common_timestamp.usecs-$ts1:onmatch(net.net_dev_queue).net_startxmit_latency(common_pid,$startxmit_latency) if comm=="sample-app-tapr"' >> \
    /sys/kernel/debug/tracing/events/net/net_dev_start_xmit/trigger
$ echo 'hist:keys=common_pid:ts3=common_timestamp.usecs:xmit_latency=common_timestamp.usecs-$ts2:onmatch(net.net_dev_start_xmit).net_xmit_latency(common_pid,$xmit_latency) if comm=="sample-app-tapr"' >> \
    /sys/kernel/debug/tracing/events/net/net_dev_xmit/trigger
$ echo 'hist:keys=common_pid:sendmsg_latency=common_timestamp.usecs-$ts3:onmatch(net.net_dev_xmit).packet_sendmsg_latency(common_pid,$sendmsg_latency) if comm=="sample-app-tapr"' >> \
    /sys/kernel/debug/tracing/events/probe/packet_sendmsg__return/trigger

$ echo 'hist:keys=pid,lat:sort=pid,lat’ >> /sys/kernel/debug/tracing/events/synthetic/packet_sendmsg_latency/trigger
$ echo 'hist:keys=pid,lat:sort=pid,lat’ >> /sys/kernel/debug/tracing/events/synthetic/net_proto_latency/trigger
$ echo 'hist:keys=pid,lat:sort=pid,lat’ >> /sys/kernel/debug/tracing/events/synthetic/net_startxmit_latency/trigger
$ echo 'hist:keys=pid,lat:sort=pid,lat’ >> /sys/kernel/debug/tracing/events/synthetic/net_xmit_latency/trigger
Finally run the sample-app-taprio application with tracing enabled and report inter-event latency histogram
$ cd /opt/intel/iotg_tsn_ref_sw/sample-app-taprio/

$ echo 1 > /sys/kernel/debug/tracing/tracing_on
$ taskset -c 1 chrt -f 99 ./sample-app-taprio -i ${interface_name} -c $RX_IP_ADDR -x 1 -w tsn_prio3-s1s2s3.cfg -b ${base_time} -z 600000 -e 50000 &
$ echo 0 > /sys/kernel/debug/tracing/tracing_on

$ cat /sys/kernel/debug/tracing/events/synthetic/net_proto_latency/hist
$ cat /sys/kernel/debug/tracing/events/synthetic/net_startxmit_latency/hist
$ cat /sys/kernel/debug/tracing/events/synthetic/net_xmit_latency/hist
$ cat /sys/kernel/debug/tracing/events/synthetic/packet_sendmsg_latency/hist
Example output
net_proto_latency
# event histogram
#
# trigger info: hist:keys=pid,lat:vals=hitcount:sort=pid,lat:size=2048 [active]
#

{ pid:       1784, lat:          4 } hitcount:         50
{ pid:       1784, lat:          5 } hitcount:      13612
{ pid:       1784, lat:          6 } hitcount:       5941
{ pid:       1784, lat:          7 } hitcount:        818
{ pid:       1784, lat:          8 } hitcount:         62
{ pid:       1784, lat:          9 } hitcount:         12
{ pid:       1784, lat:         10 } hitcount:          3
{ pid:       1784, lat:         11 } hitcount:          2
{ pid:       1784, lat:         12 } hitcount:          3
{ pid:       1784, lat:         13 } hitcount:          3
{ pid:       1784, lat:         14 } hitcount:          4
{ pid:       1784, lat:         15 } hitcount:          1
{ pid:       1784, lat:         16 } hitcount:          3
{ pid:       1784, lat:         17 } hitcount:          3

Totals:
    Hits: 20517
    Entries: 14
    Dropped: 0


net_startxmit_latency
# event histogram
#
# trigger info: hist:keys=pid,lat:vals=hitcount:sort=pid,lat:size=2048 [active]
#

{ pid:       1784, lat:          8 } hitcount:       8764
{ pid:       1784, lat:          9 } hitcount:      11587
{ pid:       1784, lat:         10 } hitcount:         92
{ pid:       1784, lat:         11 } hitcount:          8
{ pid:       1784, lat:         12 } hitcount:         17
{ pid:       1784, lat:         13 } hitcount:         14
{ pid:       1784, lat:         14 } hitcount:         12
{ pid:       1784, lat:         15 } hitcount:          7
{ pid:       1784, lat:         16 } hitcount:          6
{ pid:       1784, lat:         17 } hitcount:          2
{ pid:       1784, lat:         18 } hitcount:          4
{ pid:       1784, lat:         19 } hitcount:          1
{ pid:       1784, lat:         20 } hitcount:          1
{ pid:       1784, lat:         22 } hitcount:          1
{ pid:       1784, lat:         24 } hitcount:          1

Totals:
    Hits: 20517
    Entries: 15
    Dropped: 0


net_xmit_latency
# event histogram
#
# trigger info: hist:keys=pid,lat:vals=hitcount:sort=pid,lat:size=2048 [active]
#

{ pid:       1784, lat:          3 } hitcount:      10619
{ pid:       1784, lat:          4 } hitcount:       9847
{ pid:       1784, lat:          5 } hitcount:         32
{ pid:       1784, lat:          6 } hitcount:          8
{ pid:       1784, lat:          8 } hitcount:          2
{ pid:       1784, lat:          9 } hitcount:          3
{ pid:       1784, lat:         10 } hitcount:          1
{ pid:       1784, lat:         11 } hitcount:          2
{ pid:       1784, lat:         12 } hitcount:          1
{ pid:       1784, lat:         13 } hitcount:          1
{ pid:       1784, lat:         14 } hitcount:          1

Totals:
    Hits: 20517
    Entries: 11
    Dropped: 0


packet_sendmsg_latency
# event histogram
#
# trigger info: hist:keys=pid,lat:vals=hitcount:sort=pid,lat:size=2048 [active]
#

{ pid:       1784, lat:          3 } hitcount:       5921
{ pid:       1784, lat:          4 } hitcount:      14511
{ pid:       1784, lat:          5 } hitcount:         39
{ pid:       1784, lat:          6 } hitcount:         24
{ pid:       1784, lat:          7 } hitcount:          6
{ pid:       1784, lat:          8 } hitcount:          4
{ pid:       1784, lat:          9 } hitcount:          5
{ pid:       1784, lat:         10 } hitcount:          7

Totals:
    Hits: 20517
    Entries: 8
    Dropped: 0

Common PTP sync issues
In nominal mode to deliver egress timestamps to ptp4l, Linux loops back the original packet to the error queue of the listening socket, with the timestamps attached.
However, certain issue may be encountered under the following circumstances:
GM PTP messages TTL>1
If the Grand master clock messages have TTL>1, they will not be terminated on the boundary clock, but instead be propagated to the slaves. The slaves will thus see directly master messages, will evaluate it as the best master clock, and attempt to synchronize directly to it. Because all the traffic goes through slow path, this leads to unpredictable path delay and the slave will be unable to synchronize reasonably close to the master clock.
The issue can be corrected by either of the following ways:
Set up an iptables rule that prevents propagation of PTP packets:
# iptables -I FORWARD -p udp -m udp --dport 319 -j DROP
# iptables -I FORWARD -p udp -m udp --dport 320 -j DROP
Another possibility is to have the Grand master clock send packets such that when they arrive to the switch, they have TTL of 1. Such packets are not forwarded. In ptp4l, TTL of sent packets is configured by the udp_ttl option.
Overwhelmed with ingress PTP traffic
If that socket is already overwhelmed with ingress traffic, there may not be space to enqueue the timestamped egress traffic.
While ptp4l will not notice a missed ingress packet, it needs to wait for the timestamp of the packets that it sent (see tx_timestamp_timeout slave clock ptp4l configuration ), and will therefore notice and complain that the timestamp was not delivered.
Unfortunately, ptp4l does not allow setting of the socket receive buffer size, so if this happens, one needs to increase the default value before starting ptp4l, and then revert in back again. For example:
# sysctl -w net.core.rmem_max=4194304 # 4MB
# sysctl -w net.core.rmem_default=4194304
Use Linux Perf event with Intel® Processor Trace
Intel Processor Trace (PT) traces program execution (every branch) with low overhead.
PT is supported in Linux perf, which is integrated in the Linux kernel. It can be used through the perf command or through gdb.
In general it is best to use the newest kernel and the newest Linux perf tools. If that is not possible older tools and kernels can be used. Newer tools can be used on an older kernel, but may not support all features.
This section is not a full introduction to PT. For further information please read :
Andi Kleen’s blog general PT reference page and other blog post What is Processor Trace?
Few basic commands for creating perf PT trace record :
perf record -e intel_pt// ./programRecord a program trace
perf record -e intel_pt// -a sleep 1Record whole system Trace for 1 second
perf record -C 0 -e intel_pt// -a sleep 1Record CPU 0 trace for 1 second
perf record --pid $(pidof program) -e intel_pt//Record already running program trace .
perf record -a -e intel_pt//k sleep 1Record kernel space only trace , complete system
perf record -a -e intel_pt//uRecord user space only trace, complete system
perf record -a -e intel_pt/cyc=1,cyc_thresh=2/ ...Record fine grained timing (needs Skylake/Goldmont, adds more overhead)
perf record -e intel_pt// --filter 'filter main @ /path/to/program' ...Only record main function in program
perf record -e intel_pt// -a --filter 'filter sys_write' programFilter kernel code
perf record -e intel_pt// -a --filter 'start func1 @ program' --filter 'stop func2 @ program' programStart tracing in program at main and stop tracing at func2.Note
Check if PT is supported and what capabilities.
# ls /sys/devices/intel_pt/format/
branch  cyc  cyc_thresh  fup_on_ptw  mtc  mtc_period  noretcomp  psb_period  pt  ptw  pwr_evt  tsc
Increase
perfbuffer to limit data lossecho $[100*1024*1024] > /proc/sys/kernel/perf_event_mlock_kb perf record -m 512,100000 -e intel_pt// ...
When decoding kernel data the decoder usually has to run as root:
perf script --ns --itrace=crdecode program execution and display function call graph.perf scriptby defaults sampling the data every 100us.
perf script --ns --itrace=i0ns `` decode program execution with small *sampling* resolution using–itrace`` option, example with 10us
perf script --ns --insn-trace --xed -F,+srcline,+srccode,+insn,+time,+sym,+ip,-event,-periodShow every assembly instruction executed with IA64 disassembler.
perf script --ns --itrace=i0ns -F time,sym,srcline,ipShow source lines executed (requires ELF debug symbol)Important
perfhas to save the data to disk. The CPU can execute branches much faster than than the disk can keep up, so there will be some data loss for code that executes many instructions.perfhas no way to slow down the CPU, so when trace bandwidth > disk bandwidth there will be gaps in the trace. Because of this it is usually not a good idea to try to save a long trace, but work with shorter traces. Long traces also take a lot of time to decode.
Tracing your own code
As sanity-check test we can compile a simple “Hello World” it with debugging information:
#include <stdio.h>

int main()
{
printf("Hello World!\n");
return 0;
}
# gcc -g -o hello hello.c
Setting Linux runtime initial conditions to allow seeing kernel symbols (as root)
# echo 'kernel.kptr_restrict=0' >> /etc/sysctl.conf
sysctl -p
net.ipv4.conf.default.rp_filter = 1
net.ipv4.conf.all.rp_filter = 1
kernel.kptr_restrict = 0
perf record with options -e to select intel_pt/cyc,noretcomp/u event to get Intel PT with cycle-accurate mode. We can add noretcomp to get a timing information at RET instructions.
# perf record -e intel_pt/cyc,noretcomp/u ./hello
Hello World!
[ perf record: Woken up 1 times to write data ]
[ perf record: Captured and wrote 0.012 MB perf.data ]
The expected perf script decoded outcome are that an instruction trace be back-annotated from Intel® Processor Trace records with source line information and source code:
            # perf script --ns --insn-trace --xed -F,+srcline,+srccode,+insn,+time,+sym,+ip,-event,-period
         hello 11241 [000] 988748.351134685:      7efc5245c090 [unknown] (/lib/ld-2.28.so)
ld-2.28.so[3391201090]                mov rdi, rsp
         hello 11241 [000] 988748.351134685:      7efc5245c093 [unknown] (/lib/ld-2.28.so)
ld-2.28.so[3391201093]                call 0xdfd <__per_cpu_start+0xdfd>
         hello 11241 [000] 988748.351134685:      7efc5245ce90 [unknown] (/lib/ld-2.28.so)
ld-2.28.so[3391201e90]                push rbp
         hello 11241 [000] 988748.351134685:      7efc5245ce91 [unknown] (/lib/ld-2.28.so)
ld-2.28.so[3391201e91]                mov rbp, rsp
         hello 11241 [000] 988748.351134685:      7efc5245ce94 [unknown] (/lib/ld-2.28.so)
ld-2.28.so[3391201e94]                push r15
         hello 11241 [000] 988748.351134685:      7efc5245ce96 [unknown] (/lib/ld-2.28.so)
ld-2.28.so[3391201e96]                push r14
         hello 11241 [000] 988748.351134685:      7efc5245ce98 [unknown] (/lib/ld-2.28.so)
ld-2.28.so[3391201e98]                push r13
         hello 11241 [000] 988748.351134685:      7efc5245ce9a [unknown] (/lib/ld-2.28.so)
ld-2.28.so[3391201e9a]                push r12
         hello 11241 [000] 988748.351134685:      7efc5245ce9c [unknown] (/lib/ld-2.28.so)
ld-2.28.so[3391201e9c]                mov r12, rdi
         hello 11241 [000] 988748.351134685:      7efc5245ce9f [unknown] (/lib/ld-2.28.so)
ld-2.28.so[3391201e9f]                push rbx
         hello 11241 [000] 988748.351134685:      7efc5245cea0 [unknown] (/lib/ld-2.28.so)
ld-2.28.so[3391201ea0]                sub rsp, 0x38
         hello 11241 [000] 988748.351134685:      7efc5245cea4 [unknown] (/lib/ld-2.28.so)
ld-2.28.so[3391201ea4]                rdtsc
         hello 11241 [000] 988748.351134685:      7efc5245cea6 [unknown] (/lib/ld-2.28.so)
ld-2.28.so[3391201ea6]                mov eax, eax
         hello 11241 [000] 988748.351134685:      7efc5245cea8 [unknown] (/lib/ld-2.28.so)
ld-2.28.so[3391201ea8]                shl rdx, 0x20
         hello 11241 [000] 988748.351134685:      7efc5245ceac [unknown] (/lib/ld-2.28.so)
ld-2.28.so[3391201eac]                or rdx, rax
         hello 11241 [000] 988748.351136900:      7efc5245ceaf [unknown] (/lib/ld-2.28.so)
ld-2.28.so[3391201eaf]                mov rax, qword ptr [rip+0x25f42] <brnf_frag_data_storage+0x3df9>
         hello 11241 [000] 988748.351145066:      7efc5245ceb6 [unknown] (/lib/ld-2.28.so)
ld-2.28.so[3391201eb6]                mov qword ptr [rip+0x257a3] <brnf_frag_data_storage+0x365a>, rdx
         hello 11241 [000] 988748.351145066:      7efc5245cebd [unknown] (/lib/ld-2.28.so)
ld-2.28.so[3391201ebd]                lea rdx, ptr [rip+0x25f34] <brnf_frag_data_storage+0x3deb>
         hello 11241 [000] 988748.351145066:      7efc5245cec4 [unknown] (/lib/ld-2.28.so)
ld-2.28.so[3391201ec4]                mov r14, rdx
Using Wireshark to Dissect OPC UA pubsub with time-scheduled traffic-class
Wireshark http://www.wireshark.org/download.html has a very large set of plugins for to dissect ethercat, profinet, PTP, opc-ua client/server, … at packet-level.
However in the current version, Wireshark does not provide OPC-UA UAPD UDP or ETH frame-format dissector .
please find below a method for network admin users to troubleshoot UADP packet-level with Wireshark from tcpdump :
Create
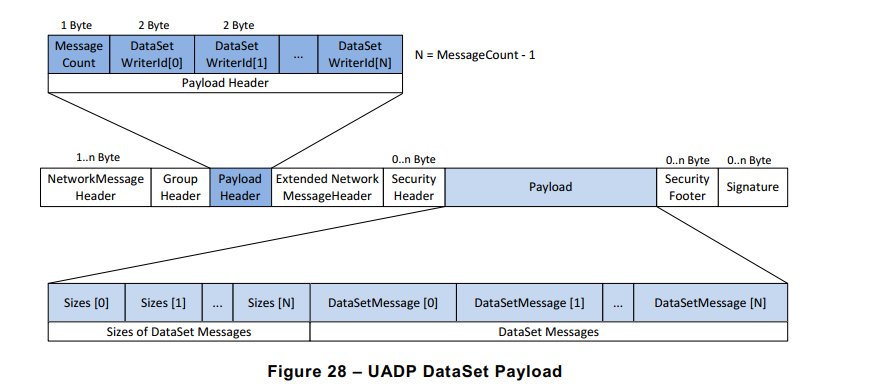
uadp_l2_dissector.luaLUA dissector file to decode UA device UADP ETH (EtherType B62C) packet content subject under 802.1Qbv scheduling policy :-- UADP Protocol Dissector for Wireshark -- Author: alexander.mildner@intel.com/florent.pirou@intel.com -- Copyright (C) Intel Germany 2019-2021 uadp_protocol = Proto("UADP", "UADP ETH Protocol") -- Protocol Field definitions according to OPC-UA pubsub realtime tutorial. -- Network Message Header version = ProtoField.uint8("uadp.NetworkMessageHeader.version", "version", base.HEX) -- Payload Header msgCount = ProtoField.uint8("uadp.PayloadHeader.msgCount", "messageCount", base.DEC) writerId = ProtoField.uint16("uadp.PayloadHeader.writerId", "writerID", base.DEC) -- Payload Dataset [0] ONLY when msgCount >1 -- size = ProtoField.uint16("uadp.PayloadDataSet0.size", "size", base.DEC) -- Data Set Message [0] Header flags1 = ProtoField.uint8("uadp.DataSetMessage0Header.flags1", "flags1", base.HEX) flags2 = ProtoField.uint8("uadp.DataSetMessage0Header.flags2", "flags2", base.HEX) timestamp = ProtoField.uint64("uadp.DataSetMessage0Header.timestamp", "timestamp", base.DEC) --nstime0 = ProtoField.absolute_time('uadp.DataSetMessage0Header.nstime', 'nstime', base.UTC) majorVersion = ProtoField.uint32("uadp.DataSetMessage0Header.majorVersion", "majorVersion", base.HEX) minorVersion = ProtoField.uint32("uadp.DataSetMessage0Header.minorVersion", "minorVersion", base.HEX) -- Data Set Message [0] Payload servertime = ProtoField.uint64("uadp.DataSetMessage0Payload.servertime", "servertime", base.DEC) -- Data Set Message [0] Payload KPIs --nstime1 = ProtoField.absolute_time('uadp.DataSetMessage0Payload.nstime', 'nstime', base.UTC) epoch1 = ProtoField.string('uadp.DataSetMessage0Payload.pl_epoch', 'pl_epoch') frame_time0 = ProtoField.double('uadp.DataSetMessage0Payload.frame_epoch', 'frame_epoch', base.DEC) diff_time1 = ProtoField.double('uadp.DataSetMessage0Payload.latency1', 'latency1', base.DEC) uadp_protocol.fields = { version, msgCount, writerId, -- size, flags1, flags2, timestamp, -- nstime0, majorVersion, minorVersion, servertime, -- nstime1, epoch1, frame_time0, diff_time1 } local frame_epochtime_f = Field.new("frame.time_epoch") function get_type(offset, buffer) local ua_type_name = "Unknown" local ua_type = buffer(offset, 1):le_uint() if ua_type == 3 then ua_type_name = "UAByte" elseif ua_type == 12 then ua_type_name = "UAString" elseif ua_type == 7 then ua_type_name = "UAUint32" elseif ua_type == 9 then ua_type_name = "UAUint64" elseif ua_type == 5 then ua_type_name = "UAUint16" elseif ua_type == 15 then ua_type_name = "UAByteString" elseif ua_type == 6 then ua_type_name = "UAInt32" end return ua_type_name end function uadp_protocol.dissector(buffer, pinfo, tree) length = buffer:len() if length == 0 then return end pinfo.cols.protocol = uadp_protocol.name local subtree = tree:add(uadp_protocol, buffer(), "UADP ETH Protocol Data") local nwmh = subtree:add("Network Message Header") nwmh:add_le(version, buffer(0,1)) local ph = subtree:add("Payload Header") ph:add_le(msgCount, buffer(1,1)) ph:add_le(writerId, buffer(2,2)) -- local ds0p = subtree:add("Data Set Payload") -- ds0p:add_le(size, buffer(4,2)) local dsm0h = subtree:add("Data Set Message [0] Header") dsm0h:add_le(flags1, buffer(4,1)) dsm0h:add_le(flags2, buffer(5,1)) dsm0h:add_le(timestamp, buffer(6,8)) -- returns a UInt64 object of the microseconds in the Tvb buffer local h_usecs = buffer(6,8):le_nstime() -- gets the seconds as a Lua number local h_secs = ( h_usecs:tonumber() / 1000000 ) -- gets the remainder as a Lua number, in nanoseconds local h_nsecs = ( h_usecs:tonumber() % 1000000 ) * 1000 -- create a NSTime object using the above local h_nstime = NSTime.new(h_secs, h_nsecs) --dsm0h:add_le(nstime0, buffer(6,8 ),h_nstime) dsm0h:add_le(majorVersion, buffer(14,4)) dsm0h:add_le(minorVersion, buffer(18,4)) -- add it to the tree, highlighting the real buffer's bytes, but with the real NSTime value local dsm0p = subtree:add("Data Set Message [0] Payload") dsm0p:add_le(servertime, buffer(25,8)) local dsm0kpi = subtree:add("Data Set Message [0] Payload Info/KPIs") -- returns a UInt64 object of the microseconds in the Tvb buffer local pl_usecs = buffer(25,8):le_nstime() local pl_epoch = buffer(25,8):le_uint64() -- gets the seconds as a Lua number -- ex: 132044265196987430 to epoch 13204426519.6987430 = 0x 01D51D8F41B1A426 local pl_secs = ( pl_usecs:tonumber() / 1000000 ) local pl_secs_epoch = ( pl_epoch / 10000000 ) -- gets the remainder as a Lua number, in nanoseconds local pl_nsecs = ( pl_usecs:tonumber() % 1000000 ) * 1000 local pl_nsecs_epoch = ( pl_epoch % 10000000 ) * 1000 -- create a NSTime object using the above local pl_nstime = NSTime.new(pl_secs, pl_nsecs) local pl_epoch_date = os.date("%x %X", pl_secs_epoch.."."..pl_nsecs_epoch) -- returns a UInt64 object of the microseconds in the Tvb buffer --dsm0kpi:add_le(nstime1, buffer(25,8), pl_nstime) local pinfo_epoch = tonumber(tostring(pinfo.abs_ts)) local pl_epoch1_str = tostring(pl_secs_epoch.."."..pl_nsecs_epoch) --local pl_epoch1_num = tonumber(pl_epoch1_str) - 0x2B6109100 local pl_epoch1_num = tonumber(pl_epoch1_str) dsm0kpi:add_le(epoch1, buffer(25,8), tostring(pl_epoch1_num)) -- 0x11CAAAD0000 -- ex: epoch 1559952919.6984302 to 15599529196984302 = 0x 00376BB06C7317EE local frameepochtime = tonumber(tostring(frame_epochtime_f())) dsm0kpi:add_le(frame_time0, buffer(25,8), frameepochtime) dsm0kpi:add_le(diff_time1, buffer(25,8), frameepochtime - pl_epoch1_num) end local eth_type = DissectorTable.get("ethertype") eth_type:add(0xB62C, uadp_protocol)
In Windows, load custom-protocol Dissector to decoded L2 UADP ETH Ethertype=
0xB62Cinto Wireshark :Open
%APPDATA%\Wireshark\pluginspaths to your Personal plugin folders.Copy the uadp_l2_dissector.lua file into the directory
In Linux, load custom-protocol Dissector to decoded L2 UADP ETH Ethertype=
0xB62Cinto Wireshark :Open Wireshark and goto: Help->About Wireshark->Folders
Find your paths to your plugin folders (any of Personal Plugins, Global Plugins, Personal Lua Plugins, Global Lua Plugins will work).
Copy the uadp_l2_dissector.lua file to the according directory (note: for copying the files to some of the directories you need to be root)
Restart Wireshark
..note:: Make sure, that there are no errors on startup otherwise check readability/accessibility of the script file!)
Run sample-app-opcua-pubsub to produce OPC-UA pubsub frames encoded and
$ taskset -c 1 ./tutorial_pubsub_publish opc.eth://ff-ff-ff-ff-ff-ff:3.5 ${interface_name}
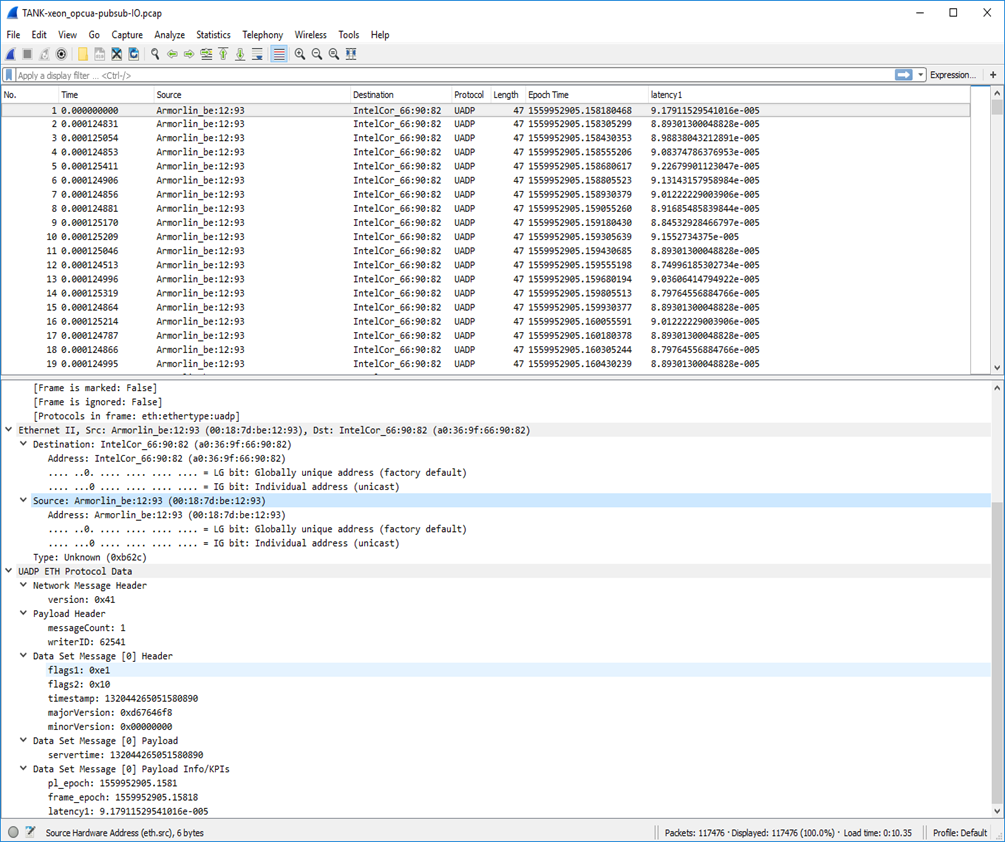
In Wireshark, capture some overly simplistic UADP ETH (
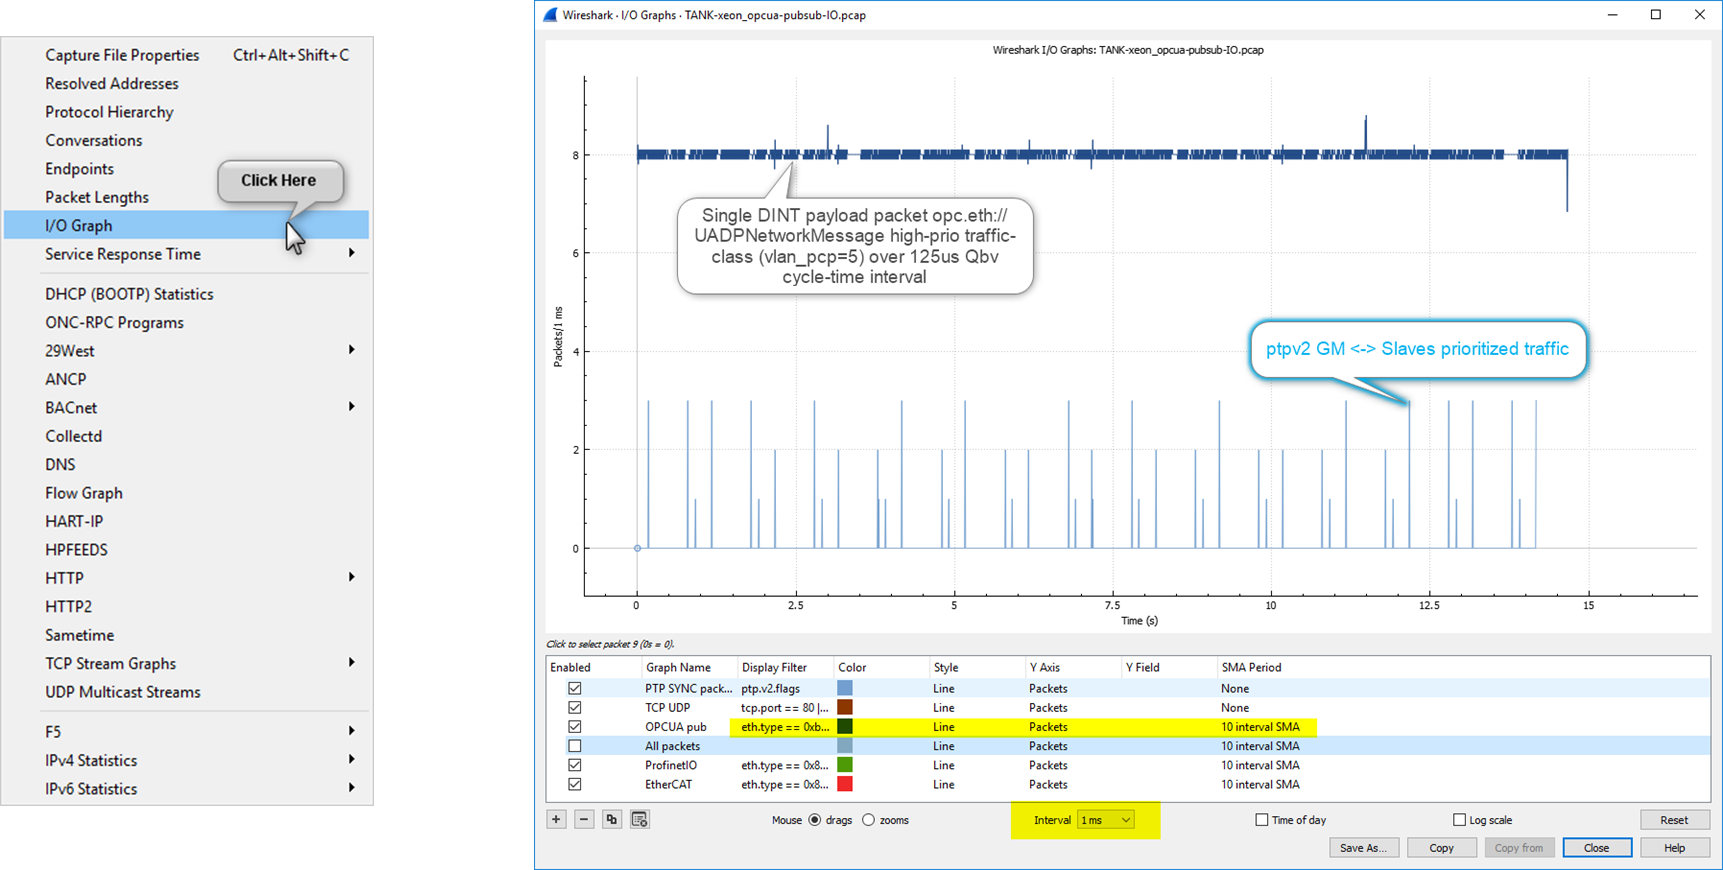
0xB62C) packets each should be automatically been decodedIn Wireshark, Display both PTP and UADP ETH traffic into IO-graph window :
Alternatively (on headless system) Run
tshark -e tmp.pcapcommand-line instead to post-processtcpdumpPCAP and report-out uadp packets fields$ tshark -X lua_script:uadp_l2_dissector.lua -r tmp.pcap -t e -2 -R uadp.PayloadHeader.writerId==1 \ -E separator=, \ -E header=n \ -Tfields \ -e frame.number \ -e frame.time_epoch \ -e uadp.PayloadHeader.writerId \ -e uadp.DataSetMessage0Payload.pl_epoch \ -e uadp.DataSetMessage0Payload.latency1 > tmp.out
Changing Kernel Configuration and Boot Parameters
In the event that a different kernel configuration is desired, it is possible to edit the configuration before building the desired image.
Different target images have different kernel configurations. Kernel configuration files for all images can be found in the /eci-release/build/<target>/layers/meta-tgr/bsp/meta-poky/recipes-kernel/linux/files directory. Find the .cfg that corresponds to the desired target image and modify as desired.
Note
This can result in undesired system behavior and should only ever be done with prior knowledge on how it may affect the overall system performance.
Similarly, boot parameters can be modified in the /eci-release/build/<target>/layers/meta-tgr/bsp/meta-poky/conf/machine/tgr.conf file before building the target image, or by modifying /boot/EFI/BOOT/grub.conf or /boot/loader/entries/boot.conf on the target system once built.