Ground 0 – NGSF Foundation
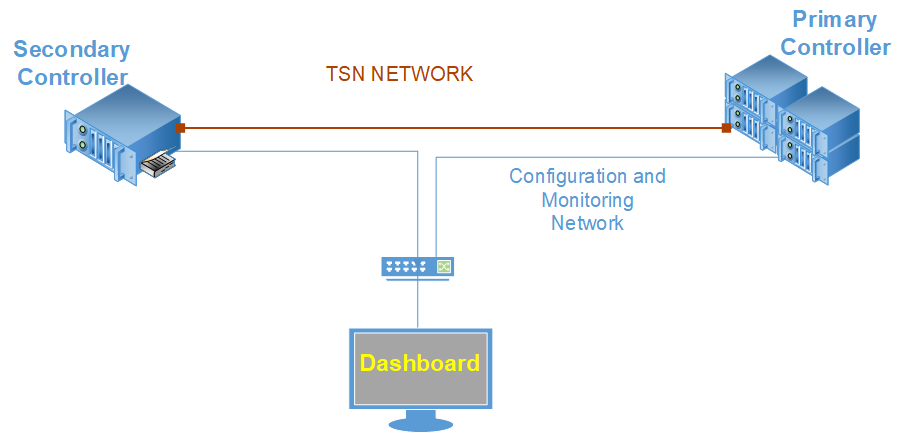
Ground zero is the initial and most fundamental NGSF setup. This setup uses a back-to-back TSN connection between two industrial PCs (IPCs) with a separate computer running the TSN dashboard and a management network.
While it is the smallest possible setup, it presents the concepts behind NGSF and the interconnection between components. Therefore, it is highly recommended to start assembling NGSF using this setup and to return to it if there are issues with any other setups.
Ground Zero: Hardware Bill of Materials
The following is the hardware used for the NGSF demo. If you use other hardware, you may need to do additional configuration steps that are not described in this section.
Two IPCs. The demo setup uses Kontron* models.
One regular Ethernet switch
One PC with Linux. The demo setup uses Ubuntu* 20.04.
One network cable (shown in red in the figure)
Three network cables (shown in blue in the figure)
Ground Zero: Software Bill of Materials
Intel® Edge Controls for Industrial
main_ctrl_app
sec_ctrl_app
tsn_dashboard
Configuration files
Script files
Ubuntu 20.04
Ground Zero: Assembly
Connect a network switch to one of the network ports of the Ubuntu machine using a network cable.
On the IPC assembly, start by booting the IPCs with ECI from a USB disk and choose the option to install it. After installing, proceed to the network setup. As shown in the following diagram, you need two networks: the TSN network shown in red and the management network shown in blue. The TSN ports and regular network management ports must be captured in both IPCs to be used in the network configuration.
Ground Zero: Preparation
Connect the Network Components
To set the network on the primary controller, add a keyboard and monitor to it. Do not make an internet cable connection yet. Once logged in, run the command:
connmanctl services
There should not be any output when this command is run.
Next, configure the management network. Connect a cable to the switch. Note that if there is only one TSN adapter in the IPC, the non-TSN one should be used. Now, run the command again:
connmanctl services
As there is a connection, the commands should return an interface as:
*AO Wired ethernet_PRIMARYADMINMAC_cable
ethernet_PRIMARYADMINMAC_cable is the returned interface. Use the returned interface in the configuration command:
connmanctl config ethernet_PRIMARYADMINMAC_cable --ipv4 manual 192.168.0.101 255.255.255.0
Repeat the same procedure with the secondary controller setting the interface to:
connmanctl config ethernet_SECADMINMAC_cable --ipv4 manual 192.168.0.102 255.255.255.0
ethernet_SECADMINMAC_cable is the interface returned by the connmanctl services command on the secondary PC when connected to the regular switch.
To test the setup, in the Linux machine, set the interface connected to the Regular switch to have the address 192.168.0.2/24. Test the connectivity using the secure shell connection by connecting to primary and secondary controllers.
Configure the TSN Network
Connect both IPCs by the TSN network adapter, and look at the interfaces on the primary and secondary nodes by using the command:
connmanctl services
On the primary node, configure the TSN interface using:
connmanctl config ethernet_PRIMARYTSNMAC_cable --ipv4 manual 10.0.0.101 255.255.255.0
On the secondary node, configure the TSN interface using:
connmanctl config ethernet_SECONDARYTSNMAC_cable --ipv4 manual 10.0.0.102 255.255.255.0
Next, establish a secure connection between the two IPCs by issuing the command:
ssh root@10.0.0.102
The interfaces are important for setting the clock synchronization and to configure the applications in general. To obtain the name of the interfaces, use the command:
ip address
On the primary controller, look for the addresses 10.0.0.101 and 192.168.0.101, where the first will be the TSN network and the second will be the administration network. On the secondary controller, execute the same task.
Similarly, you can assign the TSN network to eth0 and the regular network to eth1. Note that the values vary from system-to-system and it is important to be sure you have the right values. To keep track of all interfaces, it is recommended that you tabulate the values as shown below:
End Node |
TSN IP (Interface) |
Management Network (Interface) |
Node ID |
|---|---|---|---|
Ubuntu Box |
192.168.0.2 (eth0) |
-1 |
|
Primary Controller |
10.0.0.101 (eth1) |
192.168.0.101 (eth0) |
0 |
Secondary Controller |
10.0.0.102 (eth1) |
192.168.0.102 (eth0) |
1 |
Perform Clock Synchronization
The next step is to perform the clock synchronization, that is, run ptp4l and phc2sys and synchronize the network clocks and the system clocks. The provided scripts are used to simplify the process.
Create a config folder on the primary and secondary controllers. From the NGSF Project folder, copy:
gptp_main.confto the Primary Controller config foldergptp_secondary.confto the Secondary Controller config folderThe contents of
ngsf-4.0i/scriptstoconfboth on Primary and Secondary controllers
The TSN configuration requires several steps, which are simplified by using a configuration file. In the conf/ directory, find the configuration file and edit the fields:
INTERFACE=“eth1” #Your TSN interface here
PLATFORM=“EHL” #Your platform options are i210, i225, EHL and TGL
In the conf/configuration file on the Primary Controller, change the platform and the interface name according to the interface found and captured.
From the conf folder, source the script setup_environment.sh:
source ./setup_environment.sh
Perform the same procedure to change the configuration file and source the file on the Secondary Controller. As a prerequisite for the clock synchronization, the clocks on the devices must be set to a time closely related to each other. Look at the time provided by Primary and Secondary Controllers using the date command:
date
If clocks are not closely related, for instance if the difference is greater than minutes, use the following command to set the clocks on the primary controller:
date
The output:
My date string
On the Secondary Controller, issue the command:
date -s “My date string”
hwclock -w
Make sure that the date command shows similar results on both IPCs.
Run the following command on the Primary Controller to start synchronization of the network clocks and the system clocks:
start_sync $TSN_MAIN_INTERFACE
The TSN_MAIN INTERFACE in this example is eth0. Run the same command on the Secondary Controller.
The next step is to check the synchronization quality. First, check PTP4L logs with:
tail -l /tmp/ptp4l.log
The expected output is:
ptp4l[1610.688]: selected /dev/ptp0 as PTP clock
ptp4l[1610.706]: port 1: INITIALIZING to LISTENING on INIT_COMPLETE
ptp4l[1610.706]: port 0: INITIALIZING to LISTENING on INIT_COMPLETE
ptp4l[1618.535]: port 1: new foreign master 3ada02.fffe.1f12a9-1
ptp4l[1620.535]: selected best master clock 3ada02.fffe.1f12a9
ptp4l[1620.535]: port 1: assuming the grand master role
ptp4l[1620.535]: port 1: LISTENING to GRAND_MASTER on RS_GRAND_MASTER
If your output is different, refer to the Troubleshooting section on PTP4L on how to possibly fix the synchronization.
The synchronization of the network clock with the system clock has also been started. Run the following command to check the quality:
tail -l /tmp/phc2sys.log
The expected output is:
phc2sys[630.644]: CLOCK_REALTIME rms 11506 max 36422 freq    -62 +/-  15 delay     0 +/-   0
phc2sys[650.657]: CLOCK_REALTIME rms    7 max   15 freq    -66 +/-   6 delay     0 +/-   0
phc2sys[670.671]: CLOCK_REALTIME rms    6 max   13 freq    -65 +/-   5 delay     0 +/-   0
phc2sys[690.687]: CLOCK_REALTIME rms    7 max   14 freq    -66 +/-   6 delay     0 +/-   0
phc2sys[710.704]: CLOCK_REALTIME rms    5 max    9 freq    -66 +/-   4 delay     0 +/-   0
If your output is different, refer to the Troubleshooting section on phc2sys.
A quality synchronization with ptp4L and phc2sys offset must fall within double digits, ideally within a single digit.
Set up TSN
Once you confirm the clock synchronization, you can proceed with the TSN set up. First, stop the synchronization and perform the full setup of the system on both Primary and Secondary controllers. Run the following command:
stop_sync
Make sure that no instances of ptp4l and phc2sys is running. Run the following command:
ps
If one of them is running, run stop_sync again, because the full_setup function will start the synchronization again. That is the when the full setup function must be run setting all important features for the TSN network. Run the following commands to do the full_setup:
cd ~/config
setup_host
After configuring the full setup, it is a best practice to verify the status of the clocks again. Run the following commands:
tail -l /tmp/phc2sys.log
tail -l /tmp/ptp4l.log
The phc2sys log should be the same for Primary and Secondary controllers. However, the output for ptp4l for the Secondary controller device on a back-to-back setup is different. The following is the expected output for the Secondary:
ptp4l[1452.324]: selected /dev/ptp0 as PTP clock
ptp4l[1452.348]: port 1: INITIALIZING to LISTENING on INIT_COMPLETE
ptp4l[1452.348]: port 0: INITIALIZING to LISTENING on INIT_COMPLETE
ptp4l[1460.791]: port 1: new foreign master 3ada02.fffe.1f12a9-1
ptp4l[1462.584]: port 1: LISTENING to MASTER on ANNOUNCE_RECEIPT_TIMEOUT_EXPIRES
ptp4l[1462.584]: selected local clock aa00aa.fffe.00aa00 as best master
ptp4l[1462.584]: port 1: assuming the grand master role
ptp4l[1462.791]: selected best master clock 3ada02.fffe.1f12a9
ptp4l[1462.791]: port 1: MASTER to UNCALIBRATED on RS_SLAVE
ptp4l[1463.790]: master offset     -12776 s0 freq   -5274 path delay        22
ptp4l[1464.790]: master offset     -12937 s2 freq   -5435 path delay        21
ptp4l[1464.790]: port 1: UNCALIBRATED to SLAVE on MASTER_CLOCK_SELECTED
ptp4l[1465.790]: master offset     -12939 s2 freq  -18374 path delay        21
ptp4l[1466.790]: master offset         11 s2 freq   -9306 path delay        21
ptp4l[1467.791]: master offset       3880 s2 freq   -5433 path delay        22
ptp4l[1468.791]: master offset       3890 s2 freq   -4259 path delay        22
ptp4l[1469.791]: master offset       2708 s2 freq   -4274 path delay        20
ptp4l[1470.791]: master offset       1559 s2 freq   -4611 path delay        17
ptp4l[1471.791]: master offset        721 s2 freq   -4981 path delay        17
ptp4l[1472.791]: master offset        265 s2 freq   -5221 path delay        17
ptp4l[1473.791]: master offset         49 s2 freq   -5357 path delay        17
ptp4l[1474.791]: master offset        -44 s2 freq   -5436 path delay        18
ptp4l[1475.791]: master offset        -43 s2 freq   -5448 path delay        19
The next step is to configure the applications.
Ground Zero: Application Configuration
In this setup, three applications run on three different nodes: the dashboard, the main_ctrl_app on the primary node, and the sec_ctrl_app on the secondary node. In the previous section you defined the TSN Ethernet ports, now you must edit the ngsf.json configuration file to map those to the applications.
Within the ngsf.json file, find the “applications” section. Then, in the “publishers” subsection, edit the interface for the “Control_Default” as highlighted in following figure.
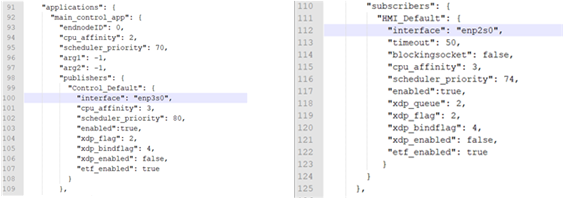
Control_Default represents the publisher for Control messages and it must be a TSN interface. Therefore, the interface to be used in the Control publisher is configured with the IP 10.0.0.101 on the primary controller IPC.
HMI_subscriber will communicate with the dashboard using the interface configured with the IP 192.168.0.101. While configuring, capture the interfaces in a table.
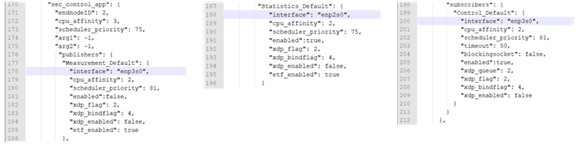
You will configure sec_ctrl_app in a similar way, for both the publisher and subscriber. The interfaces for the Measurements_Default must be the TSN network and the Statistics_Default must be the regular network. The chosen mode is statistics, which decreases the complexity of the system. The subscriber must be bound to a TSN-capable interface, that is, change the subscriber Control_Default to use the TSN interface.
For the main_ctrl_app and sec_ctrl_app applications, it is possible to enable XDP and set the flags xdp_flag and xdp_bindflag. The possible values are presented in section 4.2.
Configuring the dashboard requires only the change of interface to be used. Again, look for the tsn_dashboard section in the ngsf.json file, and change the interface to use the one that is connecting the dashboard, Linux box, to the regular switch.
As mentioned in the Configuration section, it is possible to run as Measurement_Default. To do so, all applications used must be set to enable Measurement_Default. If there is an instance of it in the publisher or subscriber, disable Statistics_Default. The interface used for Measurement_Default must be the same as the one used for Control_Default. On the primary node, main_meas_stats_app must be started. Note that not all features are available for this mode. One of the missing features is the measurement of the wheel synchronization.
Ground Zero: Running the Applications
Now that you have everything configured, it is time to run the applications.
Copy the following:
main_ctrl_appto theappfolder of the Primary controllersec_ctrl_appto theappfolder of the Secondary controllertsn_dashboardto the Linux systemngsf.jsonfile to the same folder containingmain_ctrl_app,sec_ctrl_app, andtsn_dashboard
On the Primary controller, run the following command:
cd app
NGSFDBG=“True” ./main_ctrl_app
Similarly, run the following command on the Secondary controller:
cd app
NGSFDBG=“True” ./sec_ctrl_app
On the Linux system, run the following command:
cd app
sudo ./tsn_dashboard
By default, traces should appear on the dashboard. At an early stage, the best hint to understand how well things work is the end-to-end (E2E) latency. Configure the dashboard to display the E2E latency. The values should be in the range of 400 to 700us for a cycle time of 500us. If values oscillate between negative and positive numbers, it can indicate that TSN is not properly configured or issues with clock synchronization. Refer to the NGSF Troubleshooting section.
Run the following commands to stop the applications at any time:
killall -9 main_ctrl_app
killall -9 sec_ctrl_app
The next section presents the Key Performance Indicators (KPIs) that are valid and can be used with this setup.
Ground Zero: Key Performance Indicators
Following are the Key Performance Indicators (KPIs) captured with this setup.
Min/Max/Ave Rx Jitter
Min/Max/Ave E2E latency
Min/Max/Ave Rx cycle
Min/Max/Ave Phc2sys time diff
Min/Max/Ave Read Sys Clock latency
Min/Max/Ave Read Ph Clock latency
Number of lost packets
As servomotors are not included in this setup yet, the corresponding measurements are not present.
To review the extensive list of indicators present in the NGSF demo, refer to OPC UA Messaging.