Setup Two
This setup introduces new hardware and adds an FPGA as a new building block. This hardware can be used as a switched end node and as a typical end node; both cases are described in this section. As in the previous setup, a separate computer is used to run the TSN dashboard and a management network. The following figure shows the real-time communication network in red and the management network in blue.
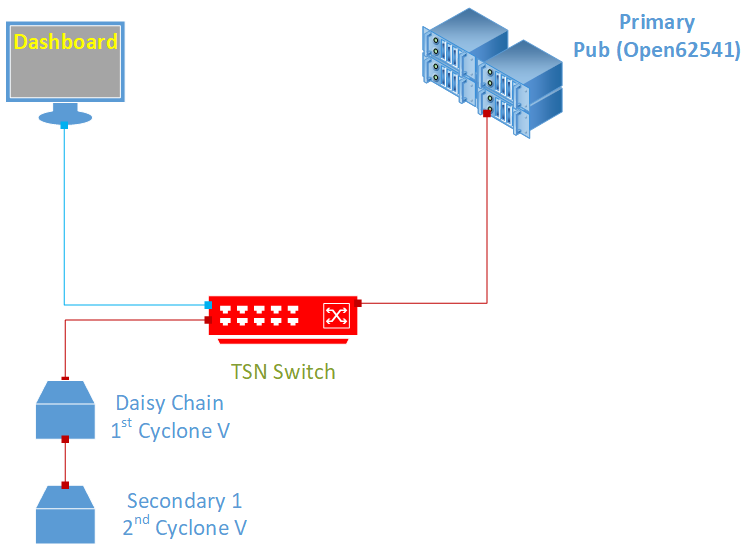
In this setup, the control of other interfaces is executed directly from the Primary controller, via the TSN network. Statistical messages are sent as multicast and will be received by the dashboard.
Setup Two: Hardware Bill of Materials
The following is the hardware used for the NGSF demo. If you use other hardware, you may need to do additional configuration steps that are not described in this section.
One Industrial PC (IPC). The demo setup uses Kontron* models.
Two Cyclone® V SoC Development Kits and Intel® SoC FPGA Embedded Development Suite
One PC with Linux. The demo setup uses Ubuntu* 20.04
Three network cables (shown in red in the figure)
One network cable (shown in blue in the figure)
TSN switch: TTTech* Edge IP Solution board
Setup Two: Software Bill of Materials
Intel® Edge Controls for Industrial
main_ctrl_appsec_ctrl_fpga_apptsn_dashboardConfiguration files for IPC nodes
Configuration files for TSN switch
Configuration files for Cyclone V
Cyclone V Linux Stack. For details on how to generate this stack, contact Intel Programmable Solutions Group Support, using “Contact us” on the webpage.
Script files
Ubuntu 20.04
Setup Two: Assembly
The starting point for this setup is Setup One. Before you add the Cyclone V to its final position in the system, you must follow the steps in the next section and set the IP address of the device.
Setup Two: Preparation
The provided Cyclone Linux stack has a default IP address 192.168.0.1/24 that must be changed to the TSN network range, that is 10.0.0.X/24. The management network has the same IP address range, so it is possible to use the already configured management network interface from the Primary controller.
Connect one internet interface of the Cyclone V board to the management network interface of the Primary controller. Connect to the Cyclone V via ssh from the Primary controller and test the connection using the following command:
ssh root@192.168.0.1
If you fail to connect to this IP, consider using the serial connection to set the IP address of the device.
Once connection is established, copy the setup_cyclonev.sh file, disconnect, and run the following command:
scp $NGSFHOME/config/setup_cyclonev.sh root@192.168.0.1:/root/.
Now, connect again, define a static IP address for the Cyclone V by editing the file:
/etc/network/interfaces
The configuration for the SE01 must be:
auto SE01
iface SE01 inet static
address 10.0.0.20
netmask 255.255.255.0
Repeat the procedure for the second Cyclone V board and change the address to:
address 10.0.0.21
In this setup, you can add additional Cyclone V boards. It is recommended that you use consecutive IP addresses, that is, the next IP address added would be 10.0.0.22/24.
Connect the Cyclone V boards as shown in the above figure, connecting the TSN Switch with the FPGA development boards and Primary controller.
Setup Two: Interface Setup
Note: These steps assume that the TSN switch is a TTTech Edge IP Solution board. If you use other hardware, you may need to do additional configuration not described in this guide.
At this point the Primary controller interfaces are set, and the IP addresses of the TSN switch and Cyclone V boards are set. The Linux box hosting the TSN dashboard is used to coordinate and start the applications. You must reconfigure the Internet interface for the TSN network, that is, reconfigure the Internet port from the Linux box to have the IP address:
10.0.0.2/24
To get the interface used, run the following command:
connmanctl services
Then, to set the interface, run the following command:
connmanctl config $ResultingInterface --ipv4 manual 10.0.0.2 255.255.255.0
Now, it is possible to start the communication with the other nodes and bridges from the Linux box hosting the TSN Dashboard. The following table lists the IP addresses for all nodes present in the setup and the node ID used on the application configuration
End Node |
TSN IP (Interface) |
Management Network (Interface) |
Node ID |
|---|---|---|---|
Ubuntu Box |
10.0.0.2 (eth0) |
-1 |
|
TSN Switch |
10.0.0.10 |
||
Primary Controller |
10.0.0.101 (eth1) |
192.168.0.101 (not used) |
0 |
Secondary Controller |
10.0.0.102 (eth1) |
192.168.0.102 (eth0) |
1 |
First Cyclone V |
10.0.0.20 (SE01) |
4 |
|
Second Cyclone V |
10.0.0.21 (SE01) |
5 |
|
Nth Cyclone V |
10.0.0.(20+N) (SE01) |
N + 4 |
As described in the previous setups, the first step is to perform clock synchronization. Remember that the clocks must be close to each other. Usually the clock taken as primary clock in the network is one of the switch clocks.
Set the date of the Primary controller to the one of the switches as indicated and proceed with the clock synchronization as presented in Setup One: Interface Setup.
In the Cyclone V boards, clock synchronization is already running as a service, therefore no additional action is required to start synchronization. It is recommended that you also check the synchronization quality on the Cyclone V boards. You can use a couple of commands for this, starting with:
date
Date provides the current date on the Cyclone V and can be used to instantly compare the date on the other machines using the same command. Set the date of the other devices if there is a difference of several minutes.
To view the status of the synchronization algorithm, run the following command:
deptp_tool --get-current-dataset
If you run this command on a secondary clock, you can expect values like the following to be returned:
source-clock-id                 00:80:82:ff:fe:85:e1:08
source-port-num                 1
steps-removed                           1
offset-from-master-scaled   483715
offset-from-master              7.380905
offset-from-master-ns               7
mean-path-delay-scaled              0
mean-path-delay                 0.000000
mean-path-delay-ns              0
If you run this command on the primary clock, only the MAC address of the clock and the port number with values will be returned.
As clock synchrony was performed several times with the Primary controller, run the following command:
cd $HOME/conf
./setup_host
For completeness, check ptp4l and phc2sys and the de-ptp tool in the Cyclone V boards.
On each Cyclone V board, execute the script:
/root/setup_cyclonev.sh
At this point, all end nodes are ready to run the application.
Next, set up the host on the Primary controller. As the clocks and host were set before successfully, it is possible to proceed directly to setup_host, after you query the date of the switch to be sure the clocks are synchronized. To confirm this, log into the switch and run the following command:
ssh root@10.0.0.11 date
Capture the result value and change the date of the primary controller:
date -s “$RESULT ABOVE”
Now, you can setup the Primary controller. Log in to the Primary controller and run the following commands:
cd config
setenv ./setup_environment.sh
setup_host
To verify the status of ptp4l and phc2sys status, run the following commands:
tail -l /tmp/ptp4l.log
tail -l /tmp/phc2sys.log
Next, set up the secondary host, repeating the procedure above for the Secondary controller, up to the step that checks the clocks.
Now, check the clocks on all systems. Open a shell for each machine and run the date command. The output must be similar for all clocks, considering the delay in issuing the commands from different terminals.
Setup Two: Application Configuration
No modification is needed on the primary controller. The same application and its respective configuration from the previous setups also apply for this setup.
The software running on the FPGA side is sec_fpga_ctrl_app represented in the motor_control_switch_app section of the ngsf.json file. For this setup, you do not need to change the Ethernet interface for the FPGA, because the FPGA has switch capability.
Copy the application and configuration to both FPGAs. Run the following commands:
ssh root@10.0.0.20 mkdir -p /root/app
scp $NGSF_BINARIES/ngsf.json root@10.0.0.20:/root/app/.
scp $NGSF_BINARIES/sec_fpga_ctrl_app root@10.0.0.20:/root/app/.
If you have two or more FPGAs in the setup, repeat the process for the rest of the FPGAs connected.
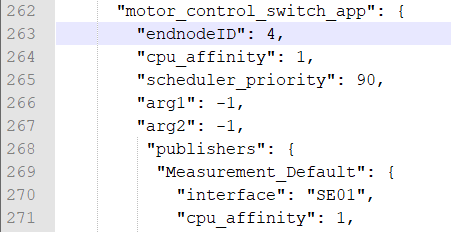
Make sure that the node IDs in the ngsf.json file are unique for each additional FPGA. For example, the following figure shows that the endnodeID for the first Cyclone V board was 4, therefore, a different value must be chosen for the second Cyclone V board.
Setup Two: Running the Applications - FPGAs as End Nodes
This section describes the procedure to run the applications when the FPGAs are used as a typical end node.
As with the previous setups, start preparing to run the applications.
Copy the following:
main_ctrl_appto theappfolder of the Primary controllersec_ctrl_appto theappfolder of the Secondary controllertsn_dashboardto the Linux system
On the Cyclone V board, copy sec_ctrl_fpga_app to the app folder along with the ngsf.json file adapted for the node, using a unique node ID as described above.
In this setup, all debugger output will be turned OFF by default. If you need the debugger output, prepend the following to the execution line:
NGSFDBG=“True”
On the Primary controller, run the following commands:
cd app
./main_ctrl_app
Similarly, on the Secondary controllers, run the following commands:
cd app
./sec_ctrl_app
Also, on the Cyclone controller(s), run the following commands:
cd app
./sec_ctrl_fpga_app
On the Linux box, run the following commands:
cd app
sudo ./tsn_dashboard
By default, traces should appear on the dashboard. Use the Preferences tab to customize the fields that must be plotted for the live data and long-term graphs.
Run the following commands to stop the applications at any time:
killall -9 main_ctrl_app
killall -9 sec_ctrl_app
killall -9 sec_ctrl_fpga_app
Setup Two: Key Performance Indicators - FPGAs as End Nodes
There are two sets of the KPIs for this setup.
The following table lists the KPIs linked to the IPCs.
Min/Max/Ave Rx Jitter
Min/Max/Ave E2E latency
Min/Max/Ave Rx cycle
Min/Max/Ave Phc2sys time diff
Min/Max/Ave Read Sys Clock latency
Min/Max/Ave Read Ph Clock latency
Number of lost packets
The following table lists the KPIs linked to the IPCs.
Min/Max/Ave Rx Jitter
Min/Max/Ave E2E latency
Min/Max/Ave Rx cycle
Number of lost packets
The difference between the two KPIs is the measurement of the time precision and latency.
Setup Two: Running the Applications - FPGAs as Switched End Nodes
This section describes how to run the applications when the FPGAs are used as switched end nodes.
Copy the following:
main_ctrl_appto theappfolder of the Primary controllersec_fpga_ctrl_appto theappfolder of each Cyclone V nodetsn_dashboardto the Linux systemngsf.jsonfile to the same folder containingmain_ctrl_app,sec_fpga_ctrl_app, andtsn_dashboard
On the Primary controller, run the following commands:
cd app
NGSFDBG=”True” ./main_ctrl_app
Similarly, on each Cyclone V machine, run the following commands:
cd app
NGSFDBG=”True” ./sec_fpga_ctrl_app
On the Linux box, run the following commands:
cd app
sudo ./tsn_dashboard
By default, traces should appear on the dashboard. Use the Preferences tab to customize the fields that must be plotted for the live data and long-term graphs.
Run the following commands to stop the applications at any time:
killall -9 main_ctrl_app
killall -9 sec_fpga_ctrl_app
Setup Two: Key Performance Indicators - FPGAs as Switched End Nodes
Following are the Key Performance Indicators (KPIs) captured with this setup.
Min/Max/Ave Rx Jitter
Min/Max/Ave E2E latency
Min/Max/Ave Rx cycle
Number of lost packets
As servomotors are not included in this setup yet, the corresponding measurements are not present.
To review the extensive list of indicators present in the NGSF demo, see Section 3.1 OPC UA Messaging.