CODESYS OPC UA Client Benchmark
The CODESYS OPC UA Client Benchmark utilizes the CODESYS SoftPLC to instantiate an OPC UA Client. Many parameters of the benchmark are modifiable such as workload type, workload iterations, noise generation, OPC UA publish interval, and OPC UA monitored item selection. Cyclic task execution times are measured from which minimum, maximum, and jitter measurements are derived. These measurements allow performance characterization of the CODESYS SoftPLC OPC UA Client implementation.
Understanding the CODESYS OPC UA Client Benchmark
A common method for an OPC UA Client to receive updated data from an OPC UA Server is via a functionality called Monitored Item. An OPC UA Client can subscribe to a list of variables that are then monitored for changes by the OPC UA Server. The variables are checked for changes at a defined interval, referred to here as the UA Server cycle. When subscribing to a variable, the Client can define a sample rate, which is then served by the Server.
The OPC UA Client also executes a task at a defined interval, referred to here as the PLC cycle. The desire is to operate on the Monitored Item data as soon as it becomes available and retain as much time as possible in the PLC cycle for a workload (Control Logic). To achieve this, the PLC cycle needs to be synchronized to the UA Server cycle such that they begin near the same time. The CODESYS OPC UA Client Benchmark conducts a calibration phase which synchronizes the PLC cycle with the UA Server cycle, as shown in the figure below:
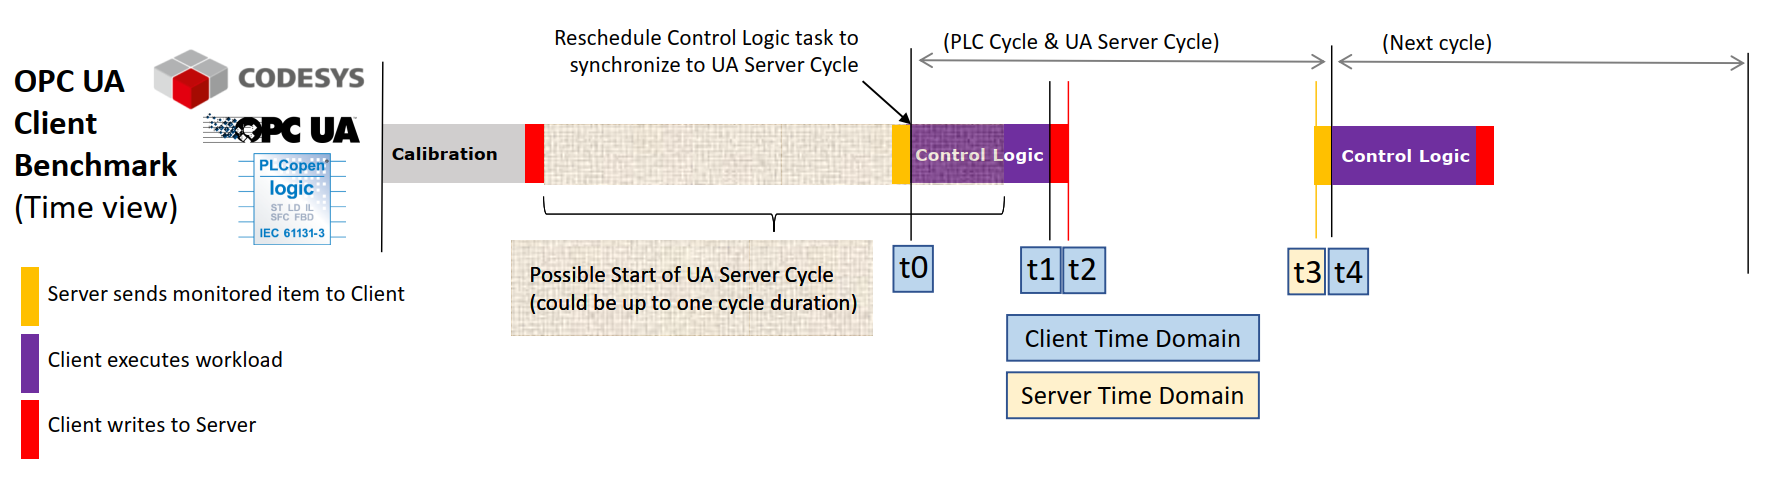
t0 = Start of Control Logic & Client receives monitored item
t1 = End of Control Logic & Client writes to Server
t2 = Server acknowledges write
t3 = Server sends monitored item (Server Timestamp)
t4 = Start of next PLC cycle
OPC UA Client Benchmark Guide
This guide will help you install, configure, and run the OPC UA Client Benchmark.
Setup OPC UA Client Benchmark
This benchmark can be ran natively, or in a container environment. Running in a container environment is easier to setup, but will perform slightly worse than running natively. If you’re running this benchmark for the first time, it is recommended to run in a container environment.
Install a container engine, if not already done:

The preferred container engine on Red Hat® Enterprise Linux® based systems is Podman. Install Podman on the target system, if not already done:
$ sudo dnf install podman


The preferred container engine on Debian and Canonical® Ubuntu® based systems is Docker. Install Docker on the target system, if not already done.
On the target system, install the
codesys-benchmark-scriptspackage from the ECI repository. Setup the ECI repository, then perform the following command to install this component:$ sudo dnf install codesys-benchmark-scripts
$ sudo apt install codesys-benchmark-scripts
Navigate to
/opt/benchmarking/codesysand build thecodesyscontrolcontainer image with thecodesys-opcua-benchmarkbenchmark:$ cd /opt/benchmarking/codesys/docker $ sudo podman build --format docker \ -f ./Dockerfile.controlruntime \ -t codesyscontrol:4.5.0.0 . \ --build-arg ECI_DEB=codesys-opcua-benchmark \ --build-arg CDS_VERSION=4.5.0.0
$ cd /opt/benchmarking/codesys/docker
$ docker build -f ./Dockerfile.controlruntime \
     -t codesyscontrol:4.5.0.0 . \
     --build-arg ECI_DEB=codesys-opcua-benchmark \
     --build-arg CDS_VERSION=4.5.0.0
Note
If you are building behind a proxy, you may need to add the following build arguments:
--build-arg http_proxy="http://<proxy:port>" --build-arg https_proxy="http://<proxy:port>".Navigate to
/opt/benchmarking/codesys/utility. This directory contains a number of useful scripts for improving the real-time performance of the CODESYS Linux runtime.The scripts available at
/opt/benchmarking/codesys/utilityinclude:start_codesys_native.sh: Optimizes the system (see list below), stops non-essential services, and restarts the CODESYS Linux runtimestart_codesys_container.sh: Optimizes the system (see list below) and starts the containerized CODESYS Linux runtime with RT priority.taskset_codesys.sh: Optimizes the system (see list below)
The scripts also perform the following runtime optimizations:
Uses Cache Allocation Technology (CAT) to allocate exclusive access of half the last-level cache to isolated cores 1 & 3 (13th generation processors and older) or 2 & 4 (14th generation processors and newer)
Assigns benchmark thread affinity to isolated cores
Assigns non-benchmark thread affinity to core 0
Changes the priority of benchmark thread to 90 (using:
chrt -f 90)Disables kernel machine check interrupt
Increases the thread runtime utilization to infinity
When executing the scripts, not all task affinity can be changed. This is expected behavior. An example output is shown below:
$ sudo /opt/benchmarking/codesys/utility/start_codesys_native.sh
Stopping unecessary services
Failed to stop ofono.service: Unit ofono.service not loaded.
Failed to stop wpa_supplicant.service: Unit wpa_supplicant.service not loaded.
Failed to stop bluetooth.service: Unit bluetooth.service not loaded.
Stopping Docker Daemon
Warning: Stopping docker.service, but it can still be activated by:
  docker.socket
Stopping Codesys Runtime
Disabling Machine Check
Disabling RT runtime limit
New COS default: 0xff0
Changing CPU affinity of existing interrupts
setting 1 to affine for core 0
setting 4 to affine for core 0
setting 8 to affine for core 0
setting 9 to affine for core 0
setting 12 to affine for core 0
setting 14 to affine for core 0
setting 16 to affine for core 0
setting 18 to affine for core 0
setting 27 to affine for core 0
setting 29 to affine for core 0
setting 120 to affine for core 0
setting 121 to affine for core 0
setting 123 to affine for core 0
setting 124 to affine for core 0
setting 125 to affine for core 0
setting 126 to affine for core 0
taskset: failed to set pid 3's affinity: Invalid argument
taskset: failed to set pid 4's affinity: Invalid argument
taskset: failed to set pid 16's affinity: Invalid argument
taskset: failed to set pid 23's affinity: Invalid argument
Starting Codesys Runtime
Changing affinity of Codesys Runtime tasks
Codesys preparation complete.
Run the
start_codesys_container.shscript available at/opt/benchmarking/codesys/utilityto reload the CODESYS Linux runtime and start the benchmark:$ cd /opt/benchmarking/codesys/utility $ sudo ./start_codesys_container.sh podman
$ cd /opt/benchmarking/codesys/utility
$ sudo ./start_codesys_container.sh
Install the CODESYS OPC UA Client Benchmark PLC logic and convenience scripts from the ECI repository:
This package is not yet available for Red Hat® Enterprise Linux®.

$ sudo apt install codesys-opcua-benchmark codesys-benchmark-scripts
Use the provided scripts to start the CODESYS Linux runtime. The scripts will perform various optimizations to minimize interrupts to the CODESYS Linux runtime. When the CODESYS Linux runtime starts, it will auto-load and execute the OPC UA Client Benchmark prebuilt PLC logic.
$ sudo /opt/benchmarking/codesys/utility/start_codesys_native.sh
The scripts available at
/opt/benchmarking/codesys/utilityinclude:start_codesys_native.sh: Optimizes the system (see list below), stops non-essential services, and restarts the CODESYS Linux runtimestart_codesys_container.sh: Optimizes the system (see list below) and starts the containerized CODESYS Linux runtime with RT prioritytaskset_codesys.sh: Optimizes the system (see list below)
The provided scripts also perform the following runtime optimizations:
Uses Cache Allocation Technology (CAT) to allocate exclusive access of half the last-level cache to isolated cores 1 & 3 (13th generation processors and older) or 2 & 4 (14th generation processors and newer)
Assigns CODESYS task affinity to isolated cores
Assigns non-CODESYS task affinity to core 0
Disables kernel machine check interrupt
Increases thread runtime utilization to infinity
When executing the scripts, not all task affinity can be changed. This is expected behavior. An example output is shown below:
$ sudo /opt/benchmarking/codesys/utility/start_codesys_native.sh
Stopping unecessary services
Failed to stop ofono.service: Unit ofono.service not loaded.
Failed to stop wpa_supplicant.service: Unit wpa_supplicant.service not loaded.
Failed to stop bluetooth.service: Unit bluetooth.service not loaded.
Stopping Docker Daemon
Warning: Stopping docker.service, but it can still be activated by:
  docker.socket
Stopping Codesys Runtime
Disabling Machine Check
Disabling RT runtime limit
New COS default: 0xff0
Changing CPU affinity of existing interrupts
setting 1 to affine for core 0
setting 4 to affine for core 0
setting 8 to affine for core 0
setting 9 to affine for core 0
setting 12 to affine for core 0
setting 14 to affine for core 0
setting 16 to affine for core 0
setting 18 to affine for core 0
setting 27 to affine for core 0
setting 29 to affine for core 0
setting 120 to affine for core 0
setting 121 to affine for core 0
setting 123 to affine for core 0
setting 124 to affine for core 0
setting 125 to affine for core 0
setting 126 to affine for core 0
taskset: failed to set pid 3's affinity: Invalid argument
taskset: failed to set pid 4's affinity: Invalid argument
taskset: failed to set pid 16's affinity: Invalid argument
taskset: failed to set pid 23's affinity: Invalid argument
Starting Codesys Runtime
Changing affinity of Codesys Runtime tasks
Codesys preparation complete.
Verify that CODESYS Linux runtime started correctly:
$ sudo systemctl status codesyscontrol
The output should show
Active: active (running):$ sudo systemctl status codesyscontrol ● codesyscontrol.service - LSB: Prepares and starts codesyscontrol Loaded: loaded (/etc/init.d/codesyscontrol; generated) Active: active (running) since Fri 2023-03-03 19:59:10 MST; 1s ago Docs: man:systemd-sysv-generator(8) Process: 121981 ExecStart=/etc/init.d/codesyscontrol start (code=exited, status=0/SUCCESS) Tasks: 2 (limit: 14185) Memory: 13.0M CGroup: /system.slice/codesyscontrol.service └─121986 /opt/codesys/bin/codesyscontrol.bin /etc/CODESYSControl.cfg Mar 03 19:59:09 eci-test systemd[1]: Starting LSB: Prepares and starts codesyscontrol... Mar 03 19:59:10 eci-test codesyscontrol[121981]: codesyscontrol started Mar 03 19:59:10 eci-test systemd[1]: Started LSB: Prepares and starts codesyscontrol.
Setup example OPC UA Server
The CODESYS OPC UA Client needs an OPC UA Server to communicate with. Any OPC UA Server which provides writable primitive (UINT, FLOAT, STRING, etc.) variables would suffice, but this example will use the EC-Protocol OPC UA Server since it is available as part of ECI. Install the
ec-scriptspackage from the ECI repository:$ sudo dnf install ec-scripts
$ sudo apt install ec-scripts
Navigate to
/opt/ec-protocol-bridge/dockerand build theec-protocol-bridgecontainer image with theopcsvrapplication andopcsvr-pubsub.yamlconfiguration:$ cd /opt/ec-protocol-bridge/docker $ sudo podman build --format docker \ -f ./Dockerfile \ -t ec-protocol-bridge:v3.1 . \ --build-arg APP=opcsvr \ --build-arg CONFIG=opcsvr-pubsub.yaml
$ cd /opt/ec-protocol-bridge/docker
$ docker build -f ./Dockerfile \
     -t ec-protocol-bridge:v3.1 . \
     --build-arg APP=opcsvr \
     --build-arg CONFIG=opcsvr-pubsub.yaml
Note
If you are building behind a proxy, you may need to add the following build arguments:
--build-arg http_proxy="http://<proxy:port>" --build-arg https_proxy="http://<proxy:port>".Navigate to
/opt/ec-protocol-bridge/docker. This directory contains a number of useful scripts for improving the real-time performance of the EC-Protocol OPC UA Server.The scripts available at
/opt/ec-protocol-bridge/dockerinclude:start_ecpb_container.sh: Optimizes the system (see list below) and starts the containerized EC-Protocol OPC UA Server with RT priority.taskset_ecpb.sh: Optimizes the system (see list below)
The scripts also perform the following runtime optimizations:
Uses Cache Allocation Technology (CAT) to allocate exclusive access of half the last-level cache to isolated cores 1 & 3 (13th generation processors and older) or 2 & 4 (14th generation processors and newer)
Assigns benchmark thread affinity to isolated cores
Assigns non-benchmark thread affinity to core 0
Changes the priority of benchmark thread to 37 (using:
chrt -f 37)Disables kernel machine check interrupt
Increases the thread runtime utilization to infinity
When executing the scripts, not all task affinity can be changed. This is expected behavior. An example output is shown below:
$ sudo /opt/benchmarking/codesys/utility/start_ecpb_container.sh
Disabling Machine Check
Disabling RT runtime limit
New COS default: 0xff0
Changing CPU affinity of existing interrupts
setting 1 to affine for core 0
setting 4 to affine for core 0
setting 8 to affine for core 0
setting 9 to affine for core 0
setting 12 to affine for core 0
setting 14 to affine for core 0
setting 16 to affine for core 0
setting 18 to affine for core 0
setting 27 to affine for core 0
setting 29 to affine for core 0
setting 120 to affine for core 0
setting 121 to affine for core 0
setting 123 to affine for core 0
setting 124 to affine for core 0
setting 125 to affine for core 0
setting 126 to affine for core 0
taskset: failed to set pid 3's affinity: Invalid argument
taskset: failed to set pid 4's affinity: Invalid argument
taskset: failed to set pid 16's affinity: Invalid argument
taskset: failed to set pid 23's affinity: Invalid argument
Starting EC-Protocol-Bridge
Changing affinity of EC-Protocol-Bridge tasks
EC-Protocol-Bridge preparation complete.
Run the
start_ecpb_container.shscript available at/opt/ec-protocol-bridge/dockerto start theec-protocol-bridgecontainer:$ cd /opt/ec-protocol-bridge/docker $ sudo ./start_ecpb_container.sh podman
$ cd /opt/ec-protocol-bridge/docker
$ sudo ./start_ecpb_container.sh
Run the
taskset_ecpb.shscript at/opt/ec-protocol-bridge/dockerto move all EC-Protocol OPC UA Server tasks to CPU cores 1,3 (13th generation processors and older) or 2,4 (14th generation processors and newer) and change the priority of all EC-Protocol OPC UA Server tasks to RT:$ sudo ./taskset_ecpb.sh
Verify that the EC-Protocol OPC UA Server container is working correctly:
$ sudo podman logs ec-protocol-bridge
$ sudo docker logs ec-protocol-bridge
The expected output should be similar to the following:
22:45:51.453076 I server_main   ==================== Edge Control OPC UA Server 3.0 ====================
22:45:51.453123 I load_configuration    Loading configuration parameters from file: /opt/ec-protocol-bridge/./config/opcsvr-pubsub.yaml
22:45:51.453277 D display_params        Configure OPC UA Server:
22:45:51.453297 D display_params                port: 4841
22:45:51.453301 D display_params                security-type: 0
22:45:51.453303 I configure_anonymous   OPC UA Server Anonymous security has been chosen
[2023-03-09 15:45:51.453 (UTC-0700)] warn/server        AccessControl: Unconfigured AccessControl. Users have all permissions.
[2023-03-09 15:45:51.453 (UTC-0700)] info/server        AccessControl: Anonymous login is enabled
[2023-03-09 15:45:51.453 (UTC-0700)] info/server        AccessControl: x509 certificate user authentication is enabled
[2023-03-09 15:45:51.453 (UTC-0700)] warn/server        Username/Password Authentication configured, but no encrypting SecurityPolicy. This can leak credentials on the network.
[2023-03-09 15:45:51.453 (UTC-0700)] warn/userland      AcceptAll Certificate Verification. Any remote certificate will be accepted.
[2023-03-09 15:45:51.454 (UTC-0700)] info/session       TCP 0   | SecureChannel 0       | Session "Administrator"       | AddNode (i=15303): No TypeDefinition. Use the default TypeDefinition for the Variable/Object
22:45:51.462775 D display_pub_params    PubSub Publisher Configuration:
22:45:51.462806 D display_pub_params            transport-profile: http://opcfoundation.org/UA-Profile/Transport/pubsub-udp-uadp
22:45:51.462809 D display_pub_params            network-interface:
22:45:51.462811 D display_pub_params            network-address-url: opc.udp://224.0.0.22:4841
22:45:51.462812 D display_pub_params            publisher-id: 100
22:45:51.462828 D display_pub_params            writer-group-id: 200
22:45:51.462832 D display_pub_params            dataset-writer-id: 300
22:45:51.462835 D display_pub_params            cycle-time-us: 500000.000000
22:45:51.462840 D display_pub_params            security-type: 0
22:45:51.462842 D add_pub_conn  PubSub Publisher pub id: 100
[2023-03-09 15:45:51.462 (UTC-0700)] info/userland      PubSub channel requested
22:45:51.465040 D add_fields            pub node: ns=0;i=2258
22:45:51.465066 D add_writer_group      PubSub Writer Group Id: 200
22:45:51.465070 D add_writer_group      PubSub Publishing Cycle Time: 500000.000000 ms
22:45:51.465502 D add_ds_writer         PubSub Dataset Writer Id: 300
22:45:51.465771 D display_sub_params    PubSub Subscriber Configuration:
22:45:51.465790 D display_sub_params            transport-profile: http://opcfoundation.org/UA-Profile/Transport/pubsub-udp-uadp
22:45:51.465793 D display_sub_params            network-interface:
22:45:51.465794 D display_sub_params            network-address-url: opc.udp://224.0.0.22:4842
22:45:51.465810 D display_sub_params            publisher-id: 100
22:45:51.465831 D display_sub_params            writer-group-id: 200
22:45:51.465834 D display_sub_params            dataset-writer-id: 300
22:45:51.465835 D display_sub_params            cycle-time-us: 500000.000000
22:45:51.465838 D display_sub_params            security-type: 0
22:45:51.465839 D add_sub_conn  PubSub Subscriber pub id: 100
22:45:51.465840 D add_sub_conn  tran: http://opcfoundation.org/UA-Profile/Transport/pubsub-udp-uadp, , opc.udp://224.0.0.22:4842
[2023-03-09 15:45:51.465 (UTC-0700)] info/userland      PubSub channel requested
22:45:51.477178 D add_ds_reader                 sub node: ns=1;s=MyDateTime
22:45:51.477953 D load_shared_lib       Dynamically Loading Method Callback Shared Library
22:45:51.478319 I server_main   ****************************
22:45:51.478345 I server_main   *** Press CTRL+C to quit ***
22:45:51.478348 I server_main   ****************************
22:45:51.478386 D start_server  Start OPC UA Server:
22:45:51.478422 D start_server          iterate-interval-us: 500
22:45:51.478424 D start_server          thread-sched-priority: 37
22:45:51.478426 D start_server          thread-core-affinity: 3
22:45:51.478485 D create_rt_thread      OPCUA Server RT thread priority: 37
[2023-03-09 15:45:51.478 (UTC-0700)] info/eventloop     Starting the EventLoop
[2023-03-09 15:45:51.478 (UTC-0700)] info/network       TCP     | Listening on all interfaces
22:45:51.478712 D create_rt_thread      OPCUA Server RT thread CPU core: 3
[2023-03-09 15:45:51.485 (UTC-0700)] info/network       TCP 6   | Creating server socket for "0.0.0.0" on port 4841
[2023-03-09 15:45:51.506 (UTC-0700)] info/network       TCP 7   | Creating server socket for "127.0.1.1" on port 4841
[2023-03-09 15:45:51.516 (UTC-0700)] warn/network       TCP 7   | Error binding the socket to the address 127.0.1.1 (Address already in use)
Attention
The OPC UA test network may not be routed and/or may lack a default route. This causes the multicast membership registration to fail. To fix this condition, add a default route on a configured interface (using interface
enp1s0as an example):$ ip route add default dev enp1s0
Alternatively, add a route for the multicast IPv4 range:
$ ip route add 224.0.0.0/3 dev enp1s0
The CODESYS OPC UA Client needs an OPC UA Server to communicate with. Any OPC UA Server which provides writable primitive (UINT, FLOAT, STRING, etc.) variables would suffice, but this example will use the EC-Protocol OPC UA Server since it is available as part of ECI. Install the EC-Protocol OPC UA Server from the ECI repository:
This package is not yet available for Red Hat® Enterprise Linux®.
$ sudo apt install eci-connectivity-ec-bridge
Start the EC-Protocol OPC UA Server with an example configuration:
$ sudo chrt -f 37 /opt/ec-protocol-bridge/opcsvr /opt/ec-protocol-bridge/config/opcsvr-pubsub.yaml
The expected output should be similar to the following:
/opt/ec-protocol-bridge/opcsvr  /opt/ec-protocol-bridge/config/opcsvr-benchmark.yaml
22:45:51.453076 I server_main   ==================== Edge Control OPC UA Server 3.0 ====================
22:45:51.453123 I load_configuration    Loading configuration parameters from file: /opt/ec-protocol-bridge/./config/opcsvr-pubsub.yaml
22:45:51.453277 D display_params        Configure OPC UA Server:
22:45:51.453297 D display_params                port: 4841
22:45:51.453301 D display_params                security-type: 0
22:45:51.453303 I configure_anonymous   OPC UA Server Anonymous security has been chosen
[2023-03-09 15:45:51.453 (UTC-0700)] warn/server        AccessControl: Unconfigured AccessControl. Users have all permissions.
[2023-03-09 15:45:51.453 (UTC-0700)] info/server        AccessControl: Anonymous login is enabled
[2023-03-09 15:45:51.453 (UTC-0700)] info/server        AccessControl: x509 certificate user authentication is enabled
[2023-03-09 15:45:51.453 (UTC-0700)] warn/server        Username/Password Authentication configured, but no encrypting SecurityPolicy. This can leak credentials on the network.
[2023-03-09 15:45:51.453 (UTC-0700)] warn/userland      AcceptAll Certificate Verification. Any remote certificate will be accepted.
[2023-03-09 15:45:51.454 (UTC-0700)] info/session       TCP 0   | SecureChannel 0       | Session "Administrator"       | AddNode (i=15303): No TypeDefinition. Use the default TypeDefinition for the Variable/Object
22:45:51.462775 D display_pub_params    PubSub Publisher Configuration:
22:45:51.462806 D display_pub_params            transport-profile: http://opcfoundation.org/UA-Profile/Transport/pubsub-udp-uadp
22:45:51.462809 D display_pub_params            network-interface:
22:45:51.462811 D display_pub_params            network-address-url: opc.udp://224.0.0.22:4841
22:45:51.462812 D display_pub_params            publisher-id: 100
22:45:51.462828 D display_pub_params            writer-group-id: 200
22:45:51.462832 D display_pub_params            dataset-writer-id: 300
22:45:51.462835 D display_pub_params            cycle-time-us: 500000.000000
22:45:51.462840 D display_pub_params            security-type: 0
22:45:51.462842 D add_pub_conn  PubSub Publisher pub id: 100
[2023-03-09 15:45:51.462 (UTC-0700)] info/userland      PubSub channel requested
22:45:51.465040 D add_fields            pub node: ns=0;i=2258
22:45:51.465066 D add_writer_group      PubSub Writer Group Id: 200
22:45:51.465070 D add_writer_group      PubSub Publishing Cycle Time: 500000.000000 ms
22:45:51.465502 D add_ds_writer         PubSub Dataset Writer Id: 300
22:45:51.465771 D display_sub_params    PubSub Subscriber Configuration:
22:45:51.465790 D display_sub_params            transport-profile: http://opcfoundation.org/UA-Profile/Transport/pubsub-udp-uadp
22:45:51.465793 D display_sub_params            network-interface:
22:45:51.465794 D display_sub_params            network-address-url: opc.udp://224.0.0.22:4842
22:45:51.465810 D display_sub_params            publisher-id: 100
22:45:51.465831 D display_sub_params            writer-group-id: 200
22:45:51.465834 D display_sub_params            dataset-writer-id: 300
22:45:51.465835 D display_sub_params            cycle-time-us: 500000.000000
22:45:51.465838 D display_sub_params            security-type: 0
22:45:51.465839 D add_sub_conn  PubSub Subscriber pub id: 100
22:45:51.465840 D add_sub_conn  tran: http://opcfoundation.org/UA-Profile/Transport/pubsub-udp-uadp, , opc.udp://224.0.0.22:4842
[2023-03-09 15:45:51.465 (UTC-0700)] info/userland      PubSub channel requested
22:45:51.477178 D add_ds_reader                 sub node: ns=1;s=MyDateTime
22:45:51.477953 D load_shared_lib       Dynamically Loading Method Callback Shared Library
22:45:51.478319 I server_main   ****************************
22:45:51.478345 I server_main   *** Press CTRL+C to quit ***
22:45:51.478348 I server_main   ****************************
22:45:51.478386 D start_server  Start OPC UA Server:
22:45:51.478422 D start_server          iterate-interval-us: 500
22:45:51.478424 D start_server          thread-sched-priority: 37
22:45:51.478426 D start_server          thread-core-affinity: 3
22:45:51.478485 D create_rt_thread      OPCUA Server RT thread priority: 37
[2023-03-09 15:45:51.478 (UTC-0700)] info/eventloop     Starting the EventLoop
[2023-03-09 15:45:51.478 (UTC-0700)] info/network       TCP     | Listening on all interfaces
22:45:51.478712 D create_rt_thread      OPCUA Server RT thread CPU core: 3
[2023-03-09 15:45:51.485 (UTC-0700)] info/network       TCP 6   | Creating server socket for "0.0.0.0" on port 4841
[2023-03-09 15:45:51.506 (UTC-0700)] info/network       TCP 7   | Creating server socket for "127.0.1.1" on port 4841
[2023-03-09 15:45:51.516 (UTC-0700)] warn/network       TCP 7   | Error binding the socket to the address 127.0.1.1 (Address already in use)
Attention
The OPC UA test network may not be routed and/or may lack a default route. This causes the multicast membership registration to fail. To fix this condition, add a default route on a configured interface (using interface
enp1s0as an example):$ ip route add default dev enp1s0
Alternatively, add a route for the multicast IPv4 range:
$ ip route add 224.0.0.0/3 dev enp1s0
Note
Using default
/opt/ec-protocol-bridge/config/opcsvr-pubsub.yamlvalues will configure the OPC UA Server with a 500us publishing interval, task scheduling priority of 37, and CPU affinity to core 3.# This config file serves as an example of a PubSub Subscriber app-settings: log-level: "debug" thread-core-affinity: 3 # default 0 (range: 0 to {# of cores - 1}) thread-sched-priority: 37 # default 50 (range: 0 to 99, but strongly suggest a value in middle of range) server: port: 4841 iterate-interval-us: 500 security-type: 0 add-nodes: - variable-node-id: "ns=1;s=MyDateTime" datatype-node-id: "ns=0;i=294" description: "A datetime var to receive the current time from PubSub subscriber" display-name: "Current Time" pubsub-subscribers: - cycle-time-us: 500000 transport-profile: "http://opcfoundation.org/UA-Profile/Transport/pubsub-udp-uadp" network-interface: network-address-url: "opc.udp://224.0.0.22:4842" publisher-id: 100 writer-group-id: 200 dataset-writer-id: 300 nodes: - node-id: "ns=1;s=MyDateTime" pubsub-publishers: - cycle-time-us: 500000 transport-profile: "http://opcfoundation.org/UA-Profile/Transport/pubsub-udp-uadp" network-interface: network-address-url: "opc.udp://224.0.0.22:4841" publisher-id: 100 writer-group-id: 200 dataset-writer-id: 300 nodes: - node-id: "ns=0;i=2258" # UA_NS0ID_SERVER_SERVERSTATUS_CURRENTTIMEYou may verify the scheduling policy and task priority of the OPC UA Server with the following command:
$ ps f -g 0 -o pid,policy,rtprio,cmd | grep opcsvr-pubsub.yaml
9828 FF      37  \_ /opt/ec-protocol-bridge/opcsvr /opt/ec-protocol-bridge/config/opcsvr-pubsub.yaml
For more information on real-time scheduling, refer to: Linux PREEMPT_RT scheduling and Sanity check
Configure and Run OPC UA Client Benchmark
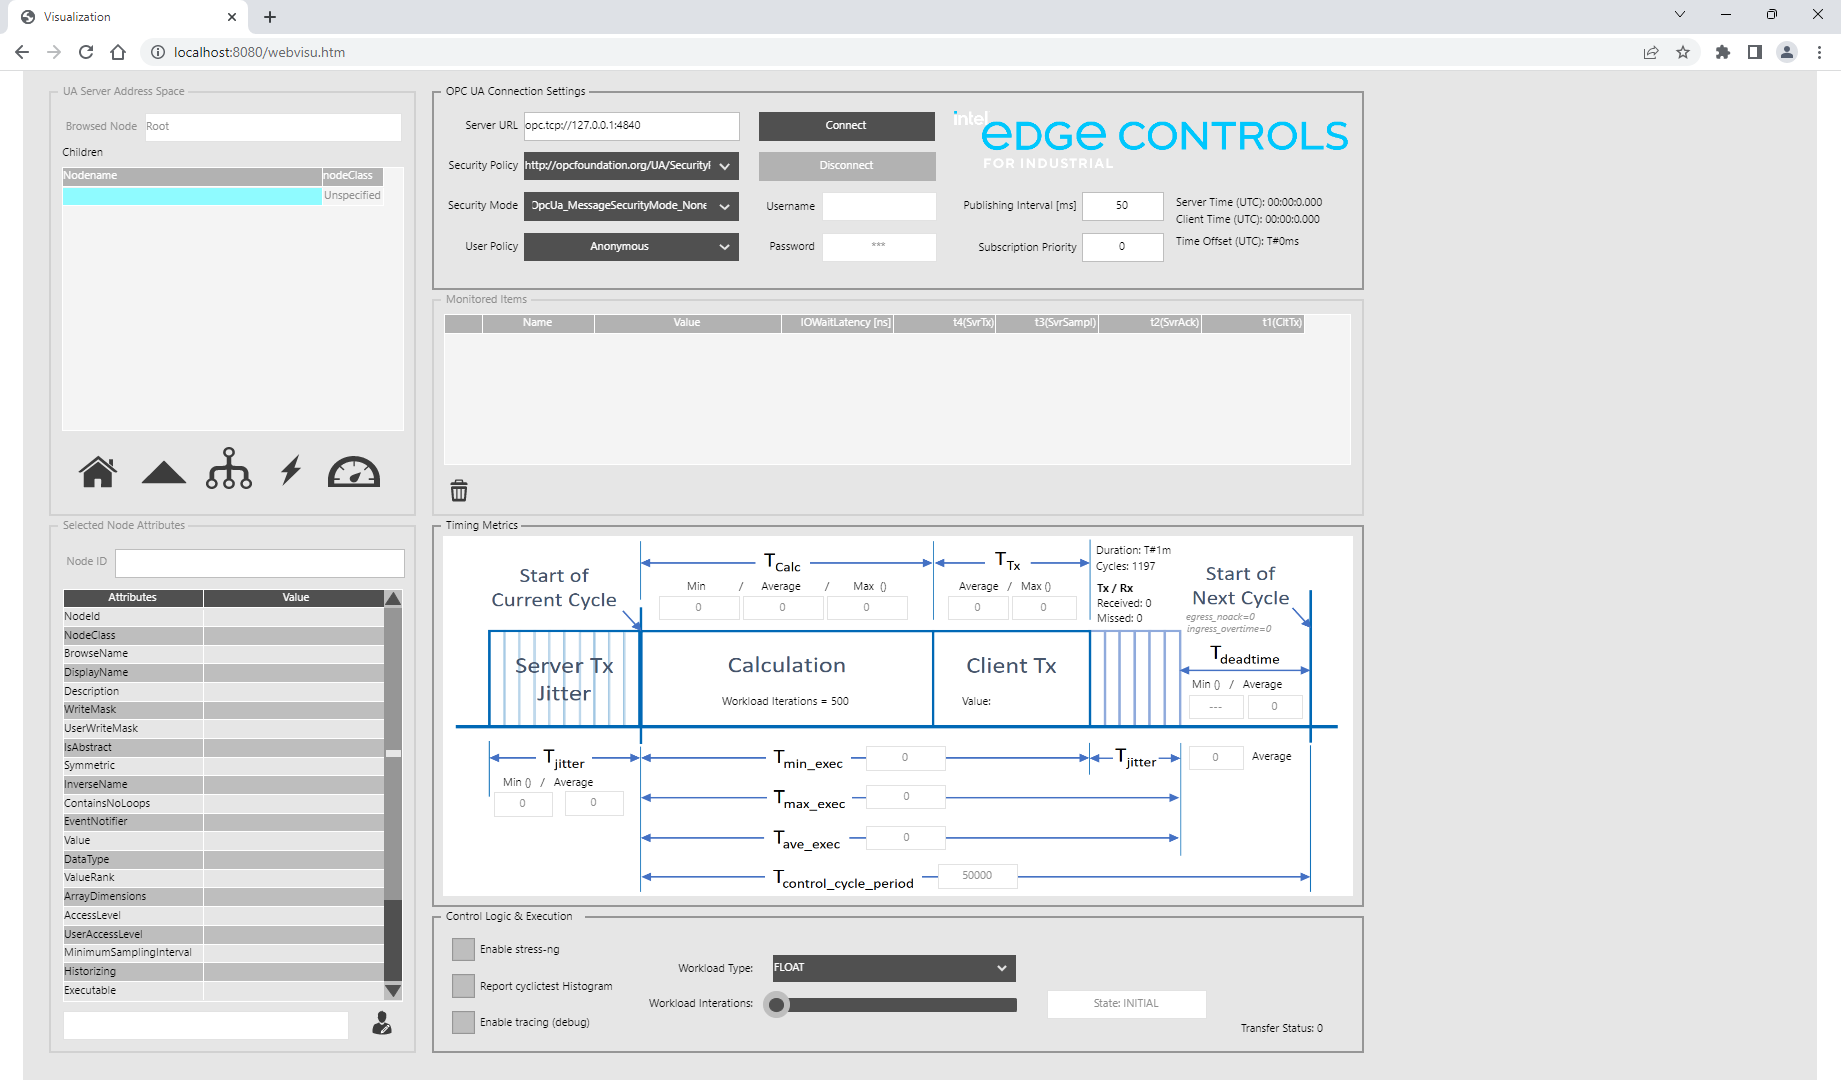
The CODESYS OPC UA Client benchmark provides a Human Machine Interface (HMI) which is accessible from a web browser. On your web browser, connect to
http://<IP-ADDRESS>:8080(replace<IP-ADDRESS>with the IP address of the system). If the system where you installed the benchmark provides a web browser, then you may connect to the HMI from http://localhost:8080.Important
All systems must be connected to the same network to establish a connection.
Tip
If you cannot connect to the web server, verify that ports 8080 and 4841 are not blocked by a firewall. On Red Hat® Enterprise Linux® based systems, you may need to open port 8080 and 4841 in the firewall with the following commands:
$ sudo firewall-cmd --zone=public --add-port=8080/tcp --permanent
$ sudo firewall-cmd --zone=public --add-port=4841/tcp --permanent
$ sudo firewall-cmd --reload
In this example, we connect to
http://10.72.32.134:8080:
Configure the OPC UA Client to connect to an OPC UA Server. If you have been following this guide, then there should be an EC-Protocol OPC UA Server running on the same host as the CODESYS benchmark. Enter
opc.tcp://127.0.0.1:4841in theServer URLinput field: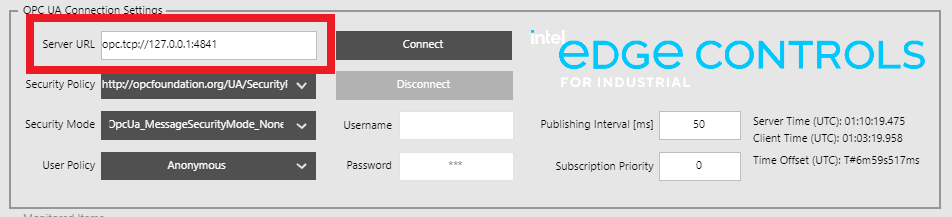
Configure the Publishing Interval of the Monitored Item. The benchmark will also use this duration for the PLC cycle time. For this example, we entered
50(milliseconds) in thePublishing Intervalinput field: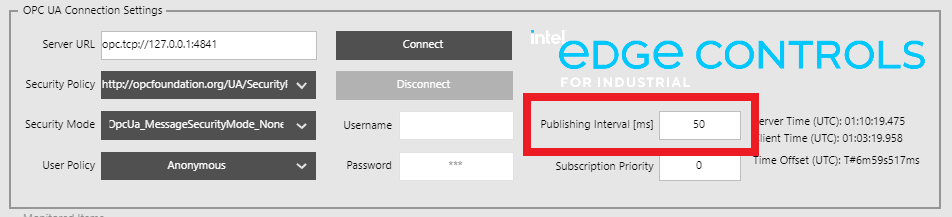
Establish a connection between the Client and Server by pressing the
Connectbutton. If the connection is successful, then theConnectbutton will become disabled, and no error messages will be present.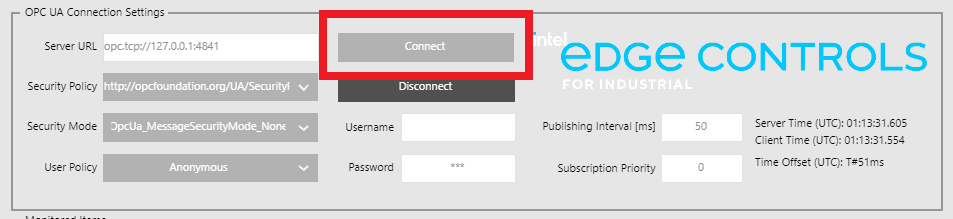
The benchmark needs to register a monitored item on the OPC UA Server. Do to limitations of the benchmark, this variable needs to be both writable, and a primitive type such as
UINT##,String,Sbyte,Int##,Float,Double,ByteString,Byte,Boolean. Browse the UA Server address space to find a suitable variable. The screenshots below demonstrate how to register a monitor item on the EC-Protocol OPC UA Server:Select
Objectsfrom theNodenamelist, then click the sub-node button (located in the middle):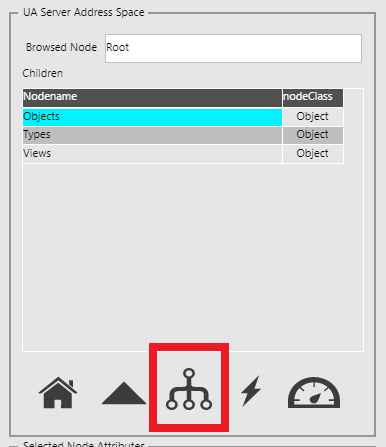
Select
StaticDatafrom theNodenamelist, then click the sub-node button: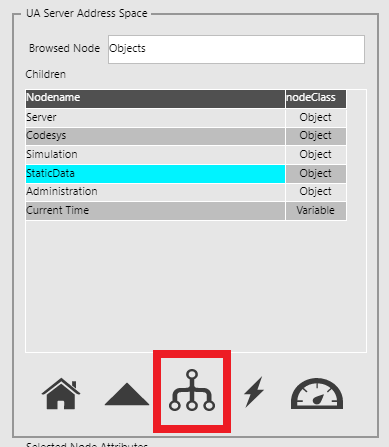
Select
StaticVariablesfrom theNodenamelist, then click the sub-node button: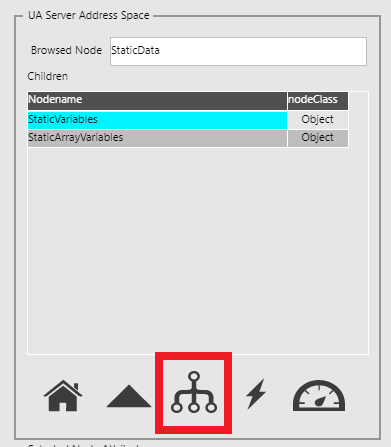
Select any of the nodes from the
Nodenamelist, then click the monitor button (located on the right). For this example, we selectedInt32: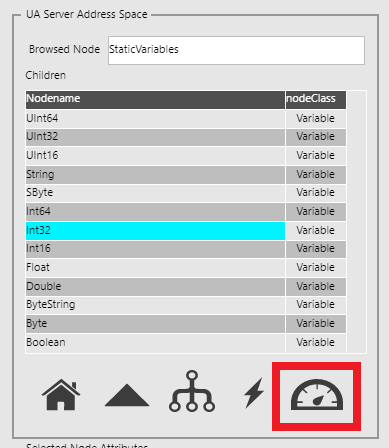
When a variable is registered as a monitored item, it will appear in the
Monitored Itemslist.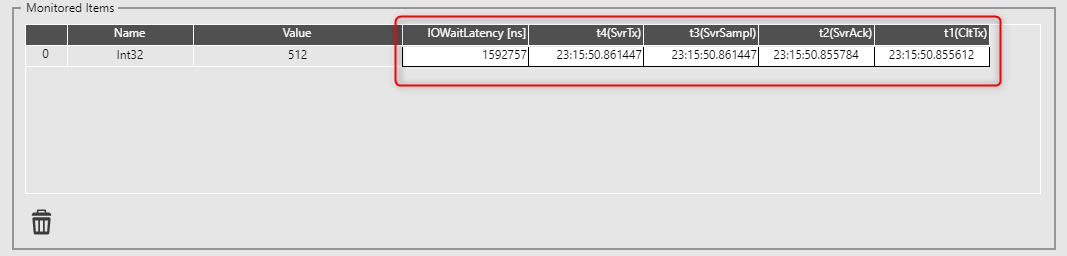
It is possible to override the value of the writable node from the
Node Attributelist. To override the value of the writable node, enter a desired value in the input field, then click theUser Editbutton (located on the right). For this example, we entered1024: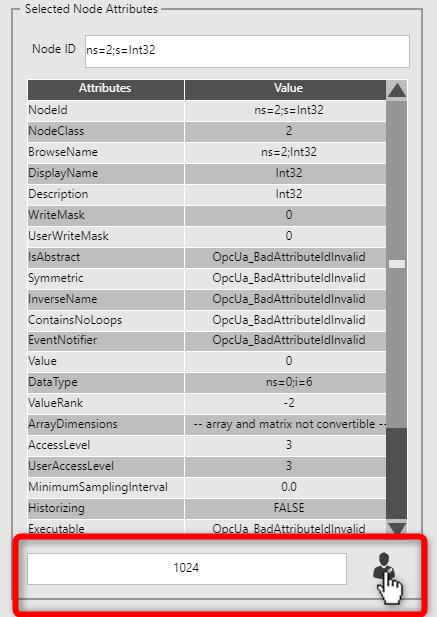
The variable registered in the
Monitored Itemslist will reflect the UA Server value change: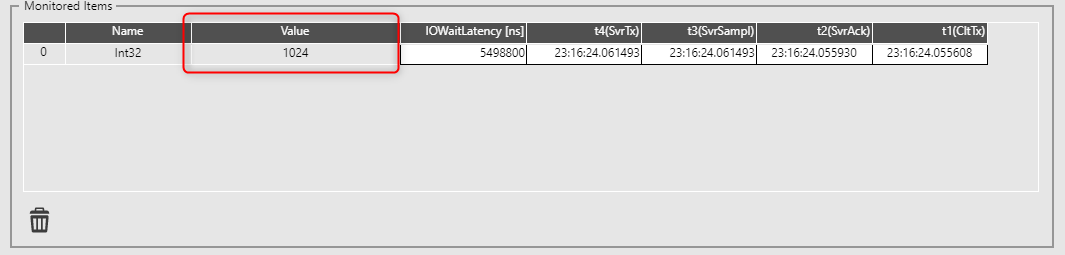
The benchmark executes a workload as part of the Control Logic. The workload type and number of iterations is configurable. You may use this to model a workload to better understand its impact on the OPC UA Client. A computationally intense workload has the potential to disrupt the OPC UA Client by exceeding the allocated PLC cycle time. Use the
Workload Typedrop-down menu to select a workload type, and use theWorkload Iterationsslider to adjust the workload iterations executed each PLC cycle.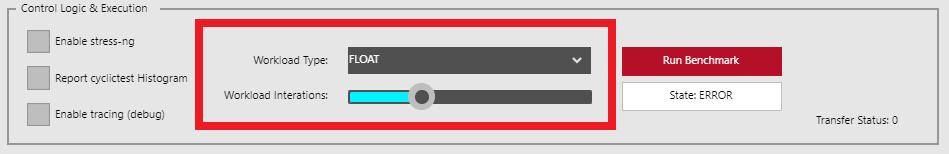
The workload types include
ARITHMETIC,FLOAT,BITWISE, andFRAGMENT. Each workload is described (along with its source code) in the tabbed view below. Click a tab to learn more:Workload consisting of purely arithmetic operations, such as addition and subtraction.
// Arithmetic Variables
lAlpha                              : LINT;
ulBeta                              : ULINT;
iDelta                              : INT;
uiGamma                             : ULINT;

// Create artificial workload
FOR uiIndex := 1 TO uiIterations + 1 DO
    // Arithmetic WL
    lAlpha := lAlpha - ULINT_TO_LINT(ulBeta);
    iDelta := LINT_TO_INT(lAlpha + iDelta);
    uiGamma := LINT_TO_ULINT(iDelta + ULINT_TO_LINT(uiGamma - ulBeta));
    lAlpha := ULINT_TO_LINT(ulBeta + ulBeta);
    ulBeta := LINT_TO_ULINT(lAlpha - iDelta);
    iDelta := ULINT_TO_INT(ulBeta + uiGamma);
    uiGamma := uiGamma - ulBeta;
    lAlpha := LINT_TO_INT(lAlpha + iDelta);
    uiGamma := LINT_TO_ULINT(iDelta + ULINT_TO_LINT(uiGamma - ulBeta));
    ulBeta := ulBeta + ulBeta;
    uiGamma := LINT_TO_ULINT(lAlpha - iDelta);
    iDelta := ULINT_TO_INT(ulBeta + uiGamma);
END_FOR
Workload consisting of a two-segment inverse kinematic algorithm, which makes heavy use of floating point operations.
// Inverse Kinematics
fPsi                                : LREAL;
fTheta                              : LREAL;
fC2                                 : LREAL;
fS2                                 : LREAL;
fL1                                 : LREAL;
fL2                                 : LREAL;
fX                                  : LREAL;
fY                                  : LREAL;

// Generate random values for workload
fX := rand(lower:=1, upper:=UINT#65535);
fY := rand(lower:=1, upper:=UINT#65535);
fL1 := rand(lower:=1, upper:=UINT#65535);
fL2 := rand(lower:=1, upper:=UINT#65535);

lAlpha := rand(lower:=1, upper:=UINT#65535);
ulBeta := rand(lower:=1, upper:=UINT#65535);
iDelta := UINT_TO_INT(rand(lower:=1, upper:=UINT#65535));
uiGamma := rand(lower:=1, upper:=UINT#65535);

bAlpha := UINT_TO_BYTE(rand(lower:=1, upper:=UINT#255));
bBeta := UINT_TO_BYTE(rand(lower:=1, upper:=UINT#255));
bDelta := UINT_TO_BYTE(rand(lower:=1, upper:=UINT#255));
bGamma := UINT_TO_BYTE(rand(lower:=1, upper:=UINT#255));

// Create artificial workload
FOR uiIndex := 1 TO uiIterations + 1 DO
    // Floating Point WL - Calculate Inverse Kinematics
    fX := ((fX / 65535.0) * cPI) + 0.1;
    fY := ((fY / 65535.0) * cPI) + 0.1;
    fL1 := ((fL1 / 65535.0) * cPI) + 0.1;
    fL2 := ((fL2 / 65535.0) * cPI) + 0.1;

    fC2 := ((EXPT(fX, 2) + EXPT(fY, 2) - EXPT(fL1, 2) - EXPT(fL2, 2)) / (2 * fL1 * fL2));
    fS2 := SQRT(ABS(1 - EXPT(fC2, 2)));
    fPsi := COS((EXPT(fX, 2) + EXPT(fY, 2) - EXPT(fL2, 2)) / (2 * fL1 * fL2));
    fTheta := SIN((fY * (fL2 + fL2 * fC2) - fX * fL2 * fS2) / (EXPT(fX, 2) + EXPT(fY, 2)));
END_FOR
Workload consisting of purely bit-wise operations, such as and, or, xor, not.
// Bitwise
bAlpha                              : BYTE;
bBeta                               : BYTE;
bDelta                              : BYTE;
bGamma                              : BYTE;

// Create artificial workload
FOR uiIndex := 1 TO uiIterations + 1 DO
    // Bitwise WL
    bDelta := bBeta XOR bGamma;
    bBeta := bDelta AND bGamma;
    bAlpha := NOT bBeta OR bAlpha;
    bGamma := bAlpha AND bDelta;
    bBeta := bBeta XOR NOT bDelta;
    bAlpha := bDelta OR bGamma;
    bGamma := bGamma AND NOT bBeta;
    bDelta := bBeta XOR bGamma;
    bBeta := NOT bGamma AND bAlpha;
    bAlpha := bBeta OR bDelta;
    bGamma := bAlpha AND bBeta;
    bDelta := NOT bGamma XOR NOT bDelta;
    bAlpha := bDelta OR bGamma;
    bBeta := bDelta AND NOT bBeta;
END_FOR
Workload consisting of a mix of all workload types and is entirely mathematical.
Refer to the CODESYS project for the complete source of the
IEC_FRAGMENTfunction block which is too long to show here.// aprox 1.5K Logic & Arithmetic code ifrag0 : IEC_FRAGMENT; // IEC-Code aprox 1.5K Logic & Arithmetic A:BOOL:= FALSE; B:INT:=8; C:REAL:=3.4; D:REAL:=8.6; T:UDINT; B1:BOOL; I1:INT; R1:REAL; // Create artificial workload FOR uiIndex := 1 TO uiIterations + 1 DO // 1K_FRAGMENT WL ifrag0(In_B1:=A, In_I1:=B,In_R1:=C,In_R2:=D); R1:= ifrag0.Out_R1; I1:= ifrag0.Out_I1; B1:= ifrag0.Out_B1; END_FORClick the
Run Benchmarkbutton to begin execution of the benchmark. Note: The benchmark will take a few seconds to prepare before live data is displayed.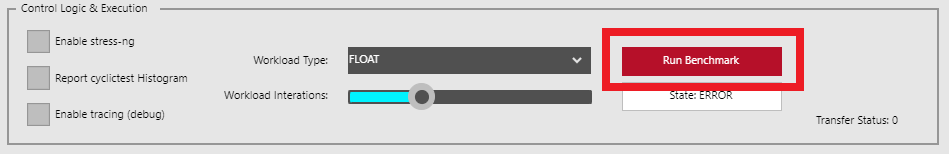
Sometimes the application cannot synchronize its schedule with the OPC UA Server. When this happens, the application status will report
UAServer calibration failed: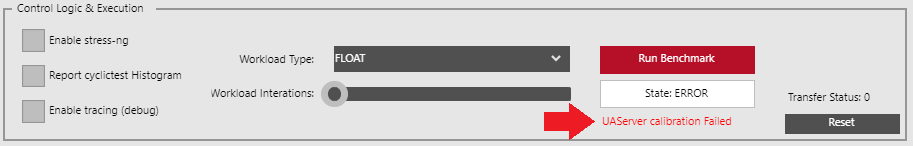
Try clicking the
Run Benchmarkbutton again to attempt calibration a second time. If the problem persists, restart the CODESYS Linux runtime using the provided script:$ sudo /opt/benchmarking/codesys/utility/start_codesys_native.sh
Attention
The CODESYS Linux runtime is free to use without a license, however it will automatically stop execution after two hours. Additionally, OPC UA client functionality is limited to only thirty minutes, after which the OPC UA client will not function. If you want to use CODESYS Linux runtime beyond these time limit, you will need to purchase a license. For information on licensing CODESYS, refer to License CODESYS Linux Runtime.
When the CODESYS Linux runtime OPC UA client timeout occurs, the OPC UA Client will disconnect from the OPC UA Server. Restart the CODESYS Linux runtime to reset the timeout and reconnect to the OPC UA Server.
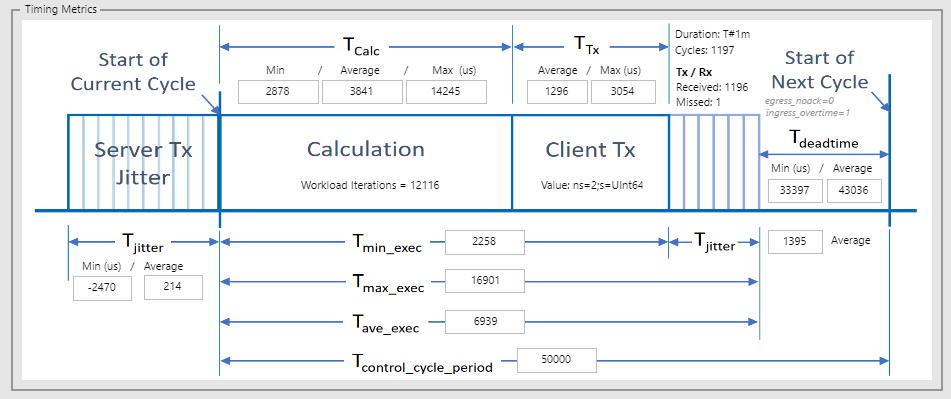
After the benchmark is complete, the
Timing Metricsdiagram will contain values pertaining to the entire run.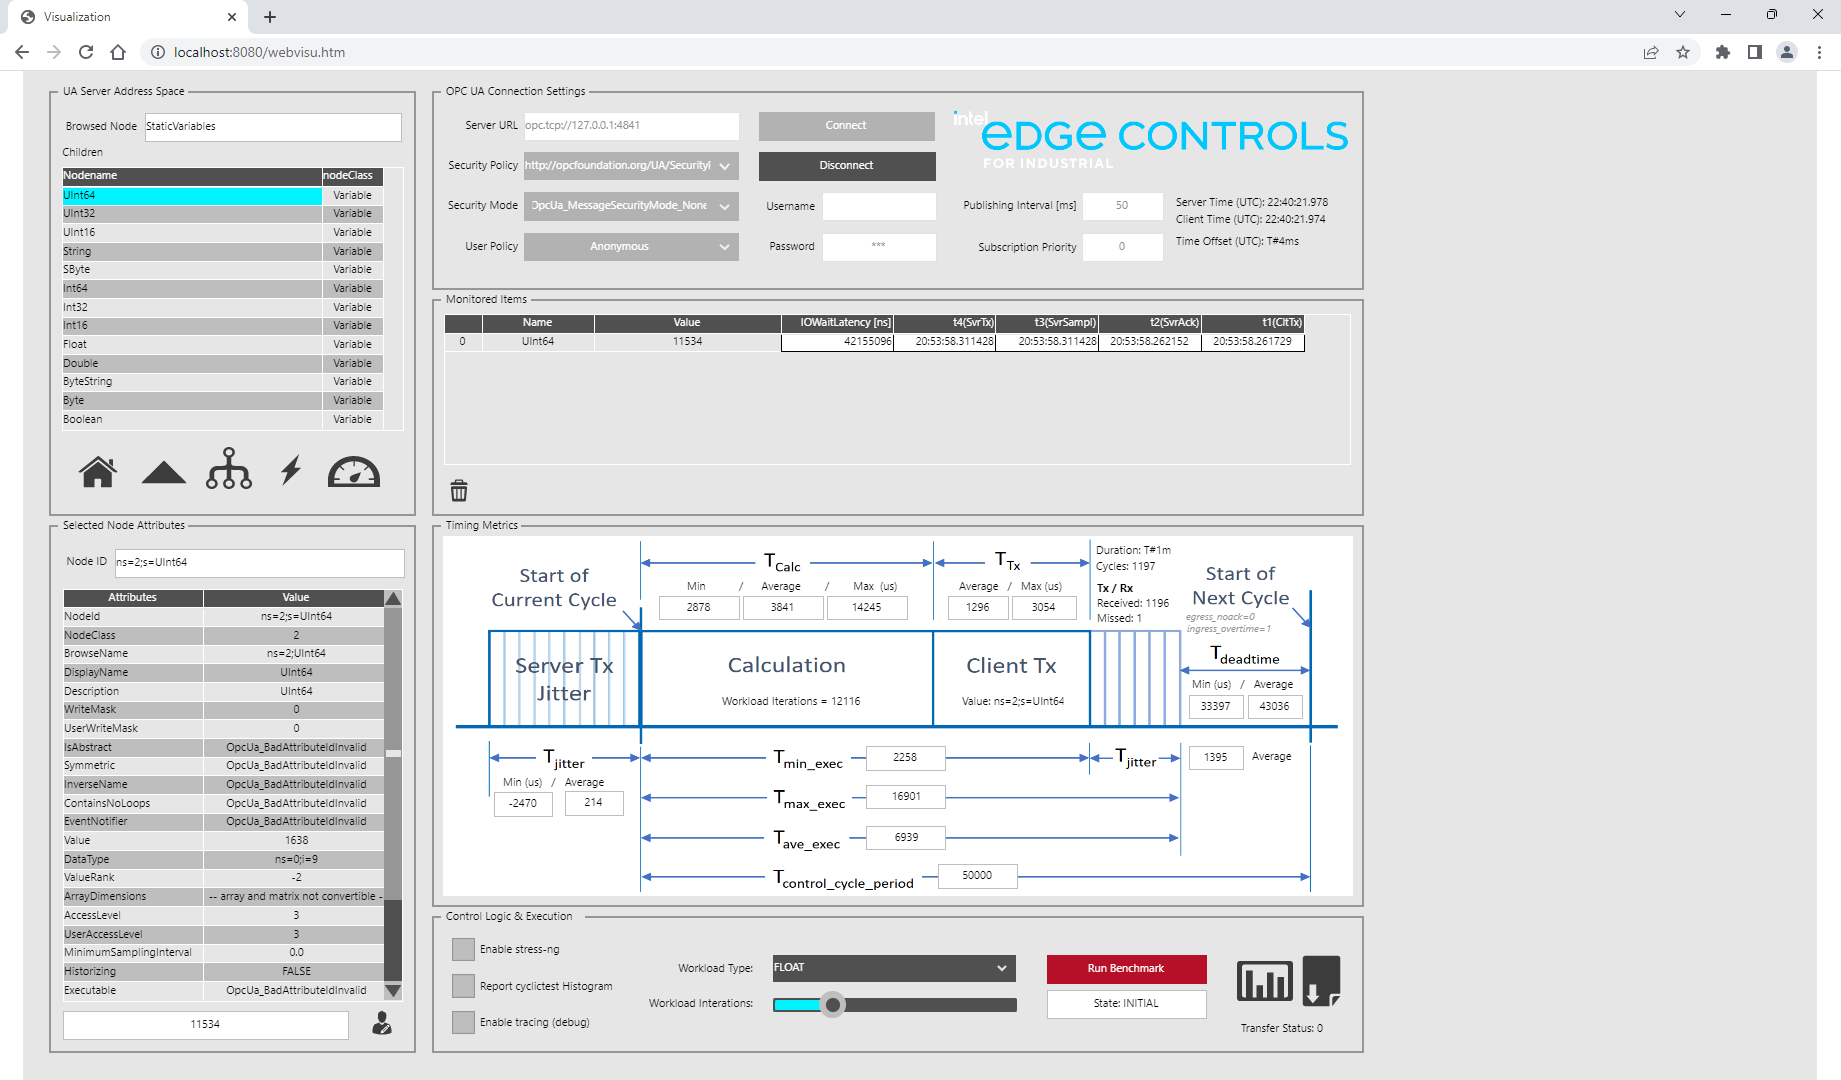
The example capture below was taken with the following configuration:
Publishing Interval: 50 (milliseconds)Workload Iterations: 12116Wokload Type: FLOAT
Measurement
Description
Duration
Time in minutes that the benchmark will execute for.
Cycles
Amount of PLC cycles executed within the Duration.
TX / RX Received
Amount of Monitored Item events received. Ideally should be equivalent to Cycles.
TX / RX Missed
Amount of Monitored Item events missed. Ideally should be zero.
egress_noack
Amount of Write events missed due to OPC UA Server non-acknowledged writes
ingress_overtime
Amount of Monitored Item events missed due to OPC UA Server missing deadline
Server Tx Jitter
Timing fluctuation of Monitor Item packets sent from the OPC UA Server.
Tjitter Average
Average jitter (microseconds) of the Monitor Item packets sent from the OPC UA Server. Ideally should be zero.
Tjitter Min
Minimum jitter (microseconds) of the Monitor Item packets sent from the OPC UA Server. Ideally should be equivalent to Tjitter Average.
Calculation
Measurement of the Control Logic workload each PLC cycle. Measurement starts at the beginning of the Control Logic workload, and ends when a write request is queued at the OPC UA Client.
TCalc Min
Minimum measured time (microseconds) taken to execute the Control Logic workload at
Workload Iterations. Ideally should be equivalent to TCalc Average.TCalc Average
Average measured time (microseconds) taken to execute the Control Logic workload at
Workload Iterationsfor the amount of Cycles.TCalc Max
Maximum measured time (microseconds) taken to execute the Control Logic workload at
Workload Iterations. Ideally should be equivalent to TCalc Average.Client TX
Measurement of the OPC UA Client write request time-of-flight. Measurement starts when a write request is queued at the OPC UA Client, and ends when an acknowledge response is received from the OPC UA Server.
TTx Average
Average measured time (microseconds) of the OPC UA Client write request time-of-flight. Ideally should be low as possible.
TTx Max
Maximum measured time (microseconds) of the OPC UA Client write request time-of-flight. Ideally should be equivalent to TTx Average.
Deadtime
Measurement of the time remaining in the PLC cycle after the workload and write request are complete. Measurement starts when an acknowledge is received from the OPC UA Server (in response to an OPC UA Client write request), and ends when a Monitored Item event is received from the OPC UA Server.
Tdeadtime Min
Minimum measured time (microseconds) remaining in the PLC cycle after the workload and write request are complete. Ideally should be equivalent to Tdeadtime Average.
Tdeadtime Average
Average measured time (microseconds) remaining in the PLC cycle after the workload and write request are complete. Ideally should be equivalent to Tcontrol_cycle_period - Tmax_exec
Calculation + Client Tx
Measurement of the round-trip latency between receiving data and writing data to the OPC UA Server. Measurement starts when a Monitored Item event is received from the OPC UA Server, and ends when an acknowledge is received from the OPC UA Server (in response to an OPC UA Client write request).
Tmin_exec
Minimum measured time (microseconds) of the round-trip latency between receiving data and writing data to the OPC UA Server. Ideally should be equivalent to Tave_exec.
Tmax_exec
Maximum measured time (microseconds) of the round-trip latency between receiving data and writing data to the OPC UA Server. Ideally should be equivalent to Tave_exec.
Tave_exec
Average measured time (microseconds) of the round-trip latency between receiving data and writing data to the OPC UA Server. Ideally should be low as possible.
Tcontrol_cycle_period
Publishing interval (microseconds) of the Monitored Item which is used to set the PLC cycle time.
Tjitter Average
Average jitter (microseconds) of the Calculation + Client Tx measurement. Ideally should be zero.
OPC UA Client Benchmark - Results
Intel® Edge Controls for Industrial publishes results for the OPC UA Client Benchmark. Compare your results against the known-good configuration to determine if your setup is performing as expected: CODESYS OPC UA Client Benchmark Results
OPC UA Client Benchmark - Stressor
The OPC UA Client Benchmark provides a stressor option using stress-ng. Enabling this option creates a more realistic environment where tasks other than the OPC UA Client Benchmark are executing on the system. This can be used to evaluate how other tasks impact the performance of the benchmark.
To enable the
stress-ngfunctionality within the OPC UA Client Benchmark, select the Enable stress-ng checkbox.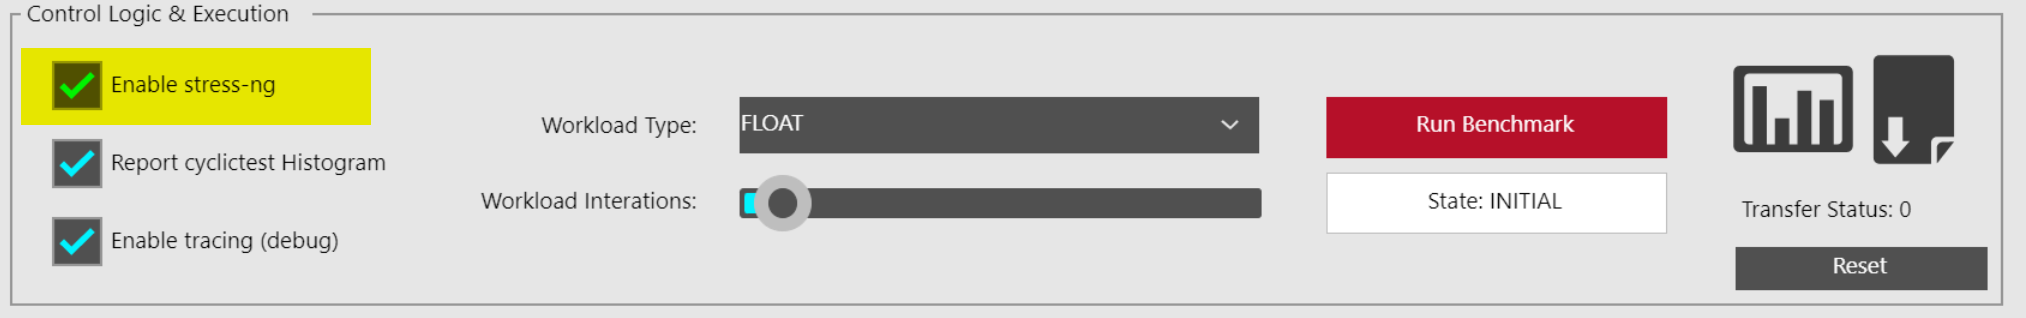
OPC UA Client Benchmark - Scorecard
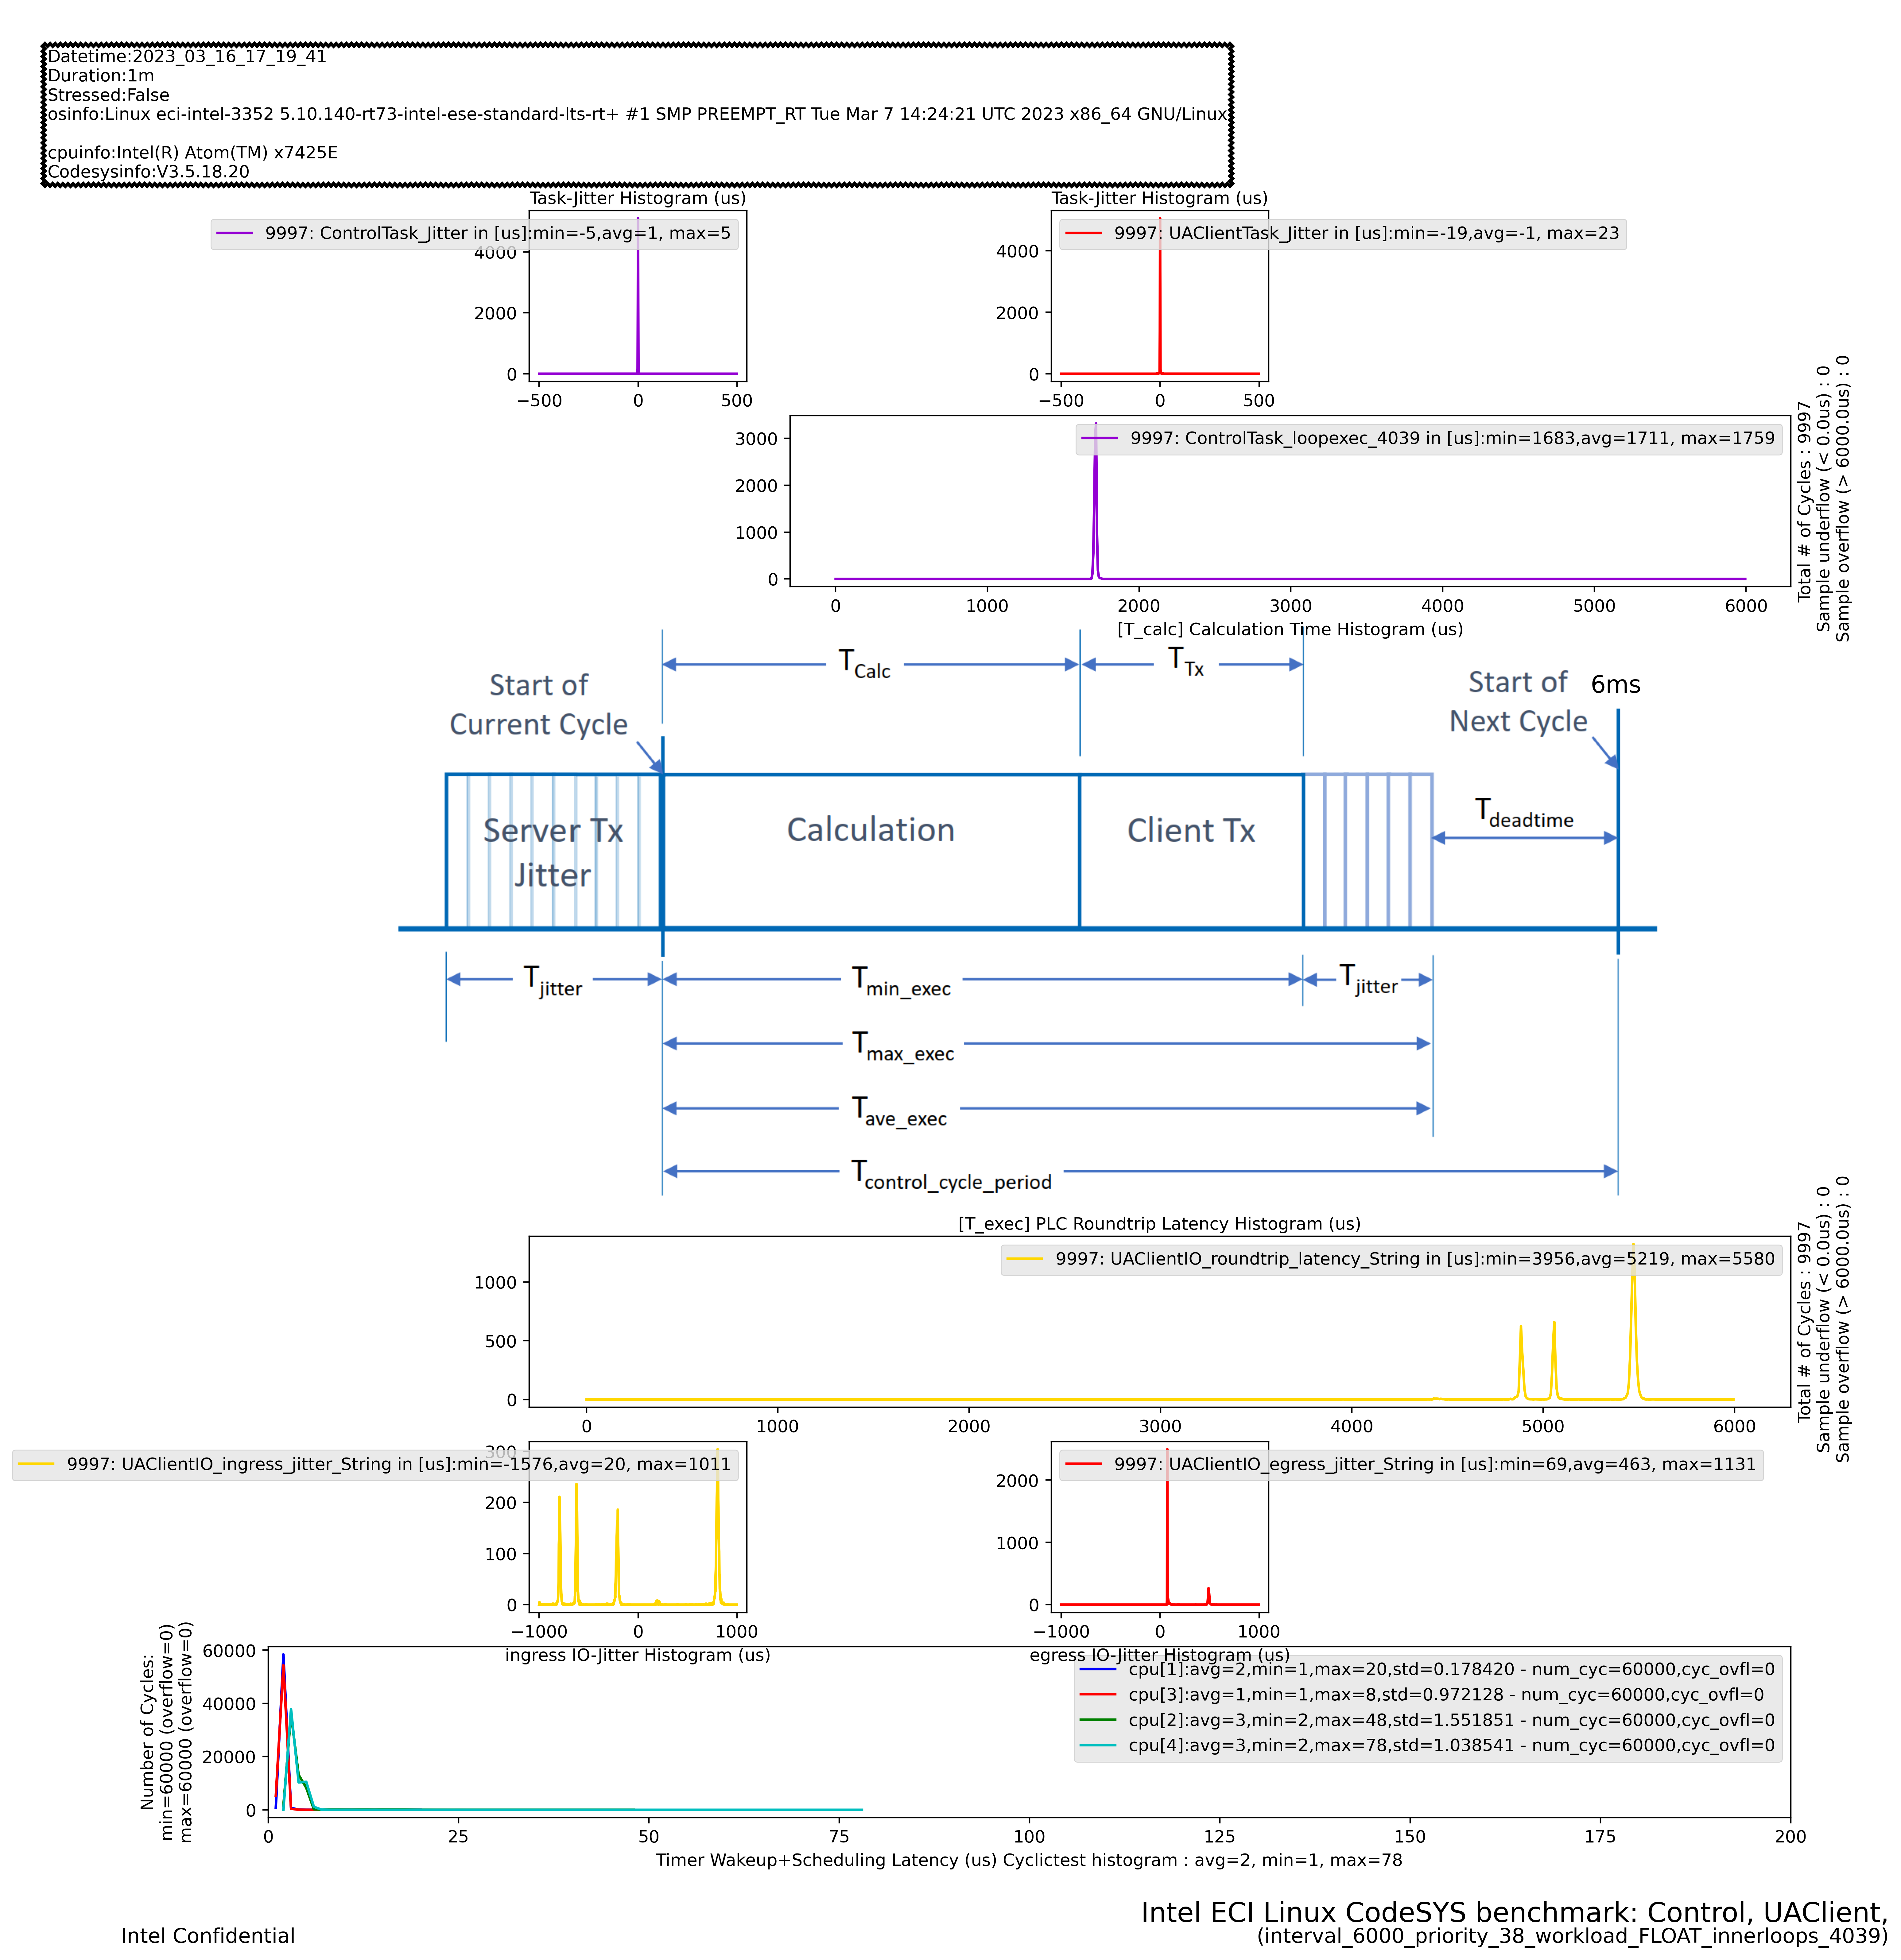
During the benchmark execution, measurements are collected and logged to a file. The OPC UA Client Benchmark provides a convenient method of visualizing these measurements in the form of histograms and line charts, referred to as a scorecard. To generate and view the scorecard, follow the steps below:
After the benchmark is complete, the OPC UA Client Benchmark will provide a graphical scorecard representation of the entire run. To download the scorecard image, click the Graph icon in the lower right corner.
This example capture was taken with the following configuration:
Publishing Interval: 6 (milliseconds) of a 250 bytes String UA datatypeWorkload Iterations: 4039Wokload Type: FLOAT
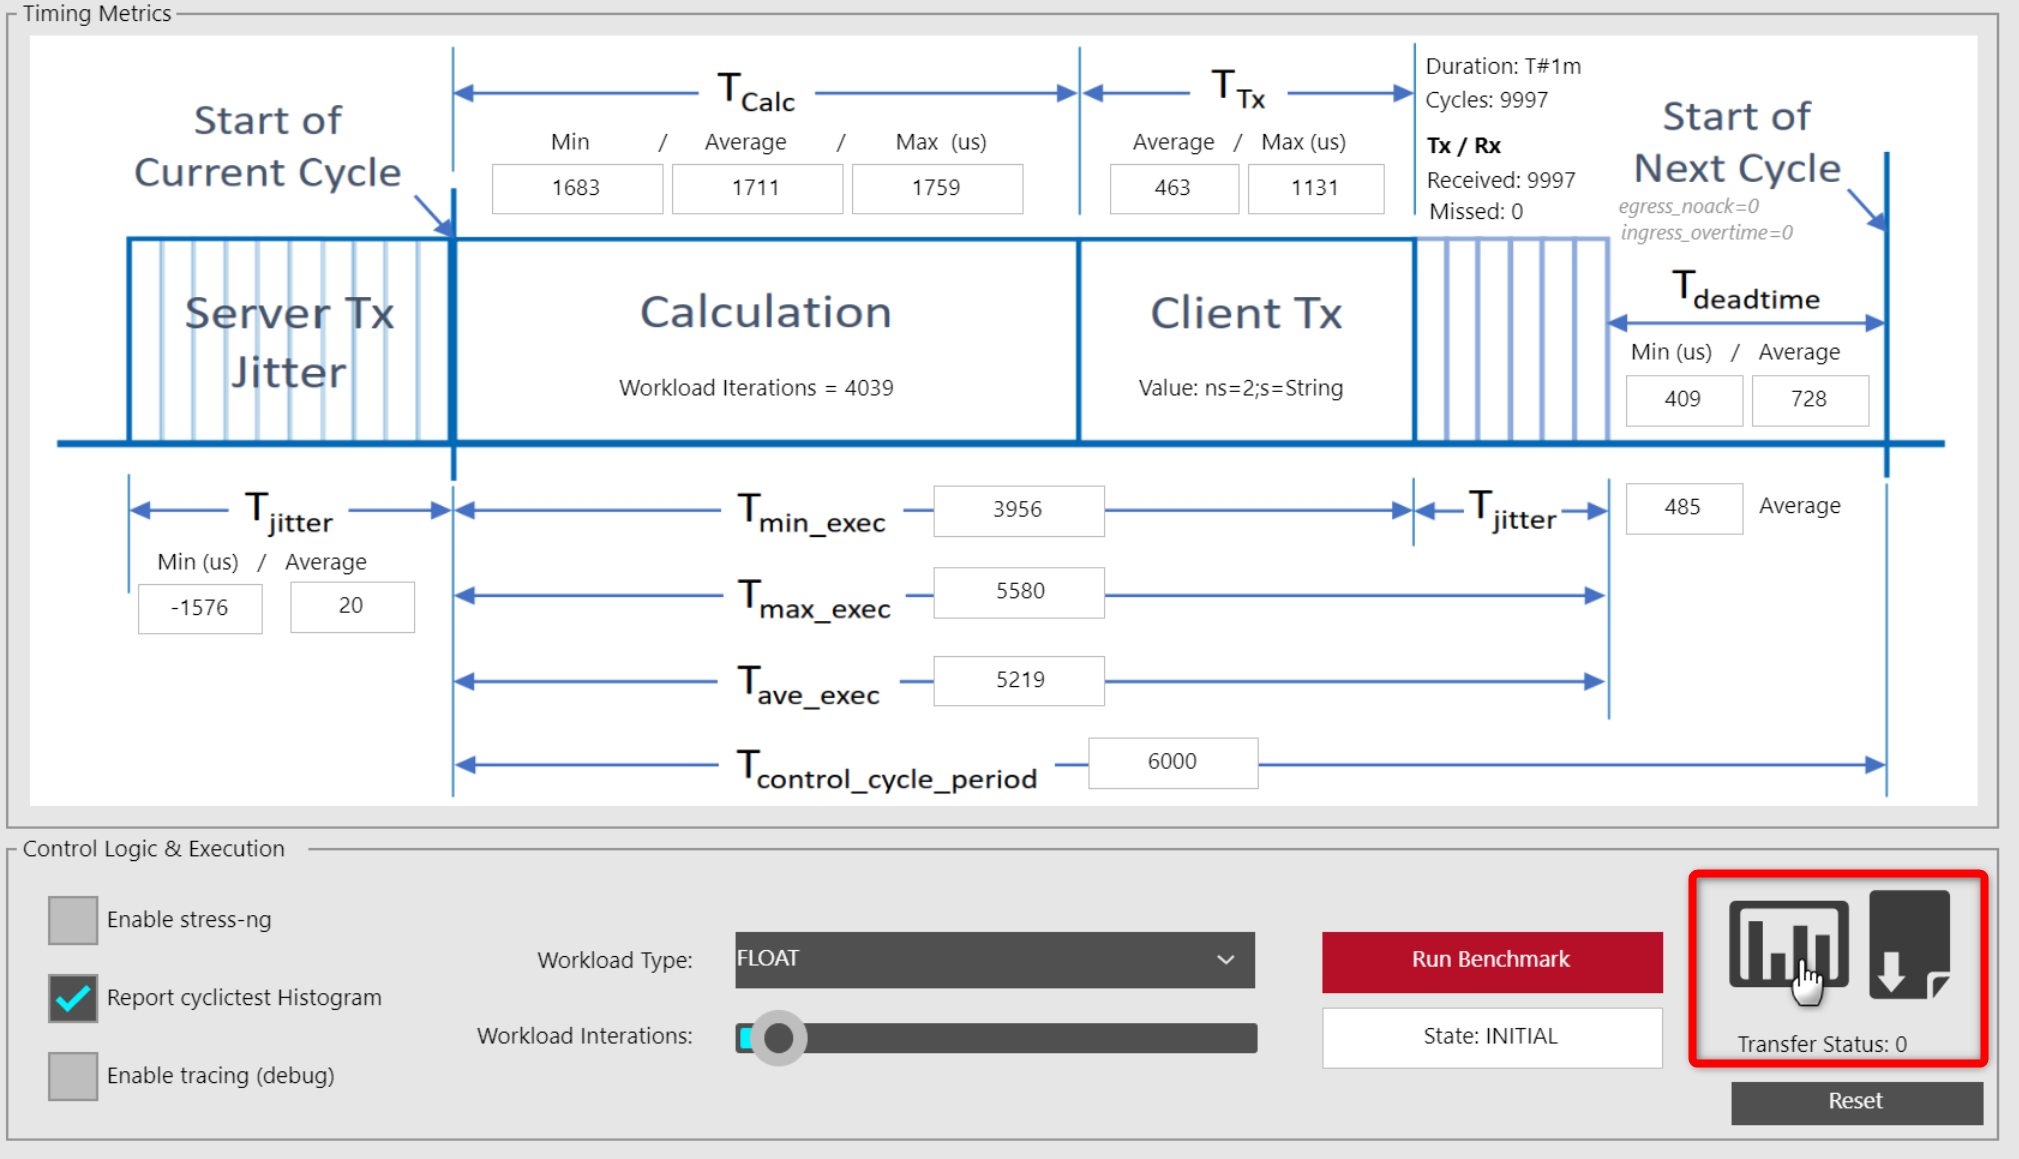
The scorecard image contains values pertaining to the entire run.
If you click on the File icon, the complete OPC UA Client Benchmark log and measurement data report will be downloaded as a ZIP archive.
Note
You can manually generate the scorecard image on any system which supports Python3. To manually generate the scorecard image, execute the following commands (replace
####_##_##_##_##_##with the desired timestamp):NOTE: Python3 libraries
python3-matplotlibandpython3-numpymust be installed.$ unzip report.zip $ /opt/benchmarking/codesys/utility/plot-codesys-benchmark-histo-txt.py -v timing -d ./PlcLogic/Application/Measurements/####_##_##_##_##_##/
The
plot-codesys-benchmark-histo-txt.pyscript supports additional optional arguments:$ /opt/benchmarking/codesys/utility/plot-codesys-benchmark-histo-txt.py --help usage: plot-codesys-benchmark-histo-txt.py [-h] [--view {timing,concentric}] [--data DATA] [--title TITLE] optional arguments: -h, --help show this help message and exit --view {timing,concentric}, -v {timing,concentric} report type --data DATA, -d DATA path to data file --title TITLE, -t TITLE title for plot
OPC UA Client Benchmark - Event Tracing
When analyzing a system, it is useful to capture trace events to better understand why a system is performing a certain way. Trace events contain timestamps of when events occurred and can be analyzed to determine thread preemption, thread execution start / stop, and other useful metrics. This information can help guide decisions on what CPU affinity and priority a thread should execute to achieve best performance.
To analyze trace events, the
catapulttool will be used. You can install this component from the ECI repository. Setup the ECI repository, then run following command to install this component:This package is not yet available for Red Hat® Enterprise Linux®.
$ sudo apt install catapult
Start the following
systemdservices to serve the Catapult REST API from the target on port8000:$ sudo systemctl enable catapult-restapi $ sudo systemctl start catapult-restapi $ sudo systemctl status catapult-restapi
? catapult-restapi.service - Catapult traceviewer REST API service
   Loaded: loaded (/lib/systemd/system/catapult-restapi.service; disabled; vendor preset: enabled)
   Drop-In: /usr/lib/systemd/system/service.d
            └─10-override-protect-proc.conf
   Active: active (running) since Thu 2018-08-30 04:50:28 UTC; 7s ago
   Main PID: 32902 (restapi_start.p)
      Tasks: 1 (limit: 9164)
   Memory: 36.3M
      CPU: 1.597s
   CGroup: /system.slice/catapult-restapi.service
            └─32902 /usr/bin/python3 /usr/share/catapult/restapi_start.py

Aug 30 04:50:30 eci-intel-23f0 restapi_start.py[32902]: *** Getting all DMI data into a XML document variable
Aug 30 04:50:30 eci-intel-23f0 restapi_start.py[32902]: [1535604629.925063] short-list available kernel trace events...
Aug 30 04:50:30 eci-intel-23f0 restapi_start.py[32902]: [1535604629.9325438] short-list available kernel perf PMU hw-events...
Aug 30 04:50:30 eci-intel-23f0 restapi_start.py[32902]: [1535604630.0594482] short-list available kernel filter functions...
Aug 30 04:50:30 eci-intel-23f0 restapi_start.py[32902]:  * Serving Flask app "restapi_start" (lazy loading)
Aug 30 04:50:30 eci-intel-23f0 restapi_start.py[32902]:  * Environment: production
Aug 30 04:50:30 eci-intel-23f0 restapi_start.py[32902]:    WARNING: This is a development server. Do not use it in a production deployment.
Aug 30 04:50:30 eci-intel-23f0 restapi_start.py[32902]:    Use a production WSGI server instead.
Aug 30 04:50:30 eci-intel-23f0 restapi_start.py[32902]:  * Debug mode: on
Aug 30 04:50:30 eci-intel-23f0 restapi_start.py[32902]:  * Running on http://0.0.0.0:8000/ (Press CTRL+C to quit)
Catapult provides a user interface which is accessible from a web browser. On your web browser, connect to
http://<IP-ADDRESS>:8000(replace<IP-ADDRESS>with the IP address of the system). If the system where you installed the benchmark provides a web browser, then you may connect to the user interface from http://localhost:8000.Important
All systems must be connected to the same network to establish a connection.
Click the Record button in the Catapult user interface to open a Recording dialog box. This dialog box is used to configure which trace events will be captured and analyzed. Select the
Manually select settingsradio button, enable themarkerscheckbox, enter819200into thebuffer_size_kbinput field, and disable all event categories by clicking theNonebutton and selecting theNoneradio button.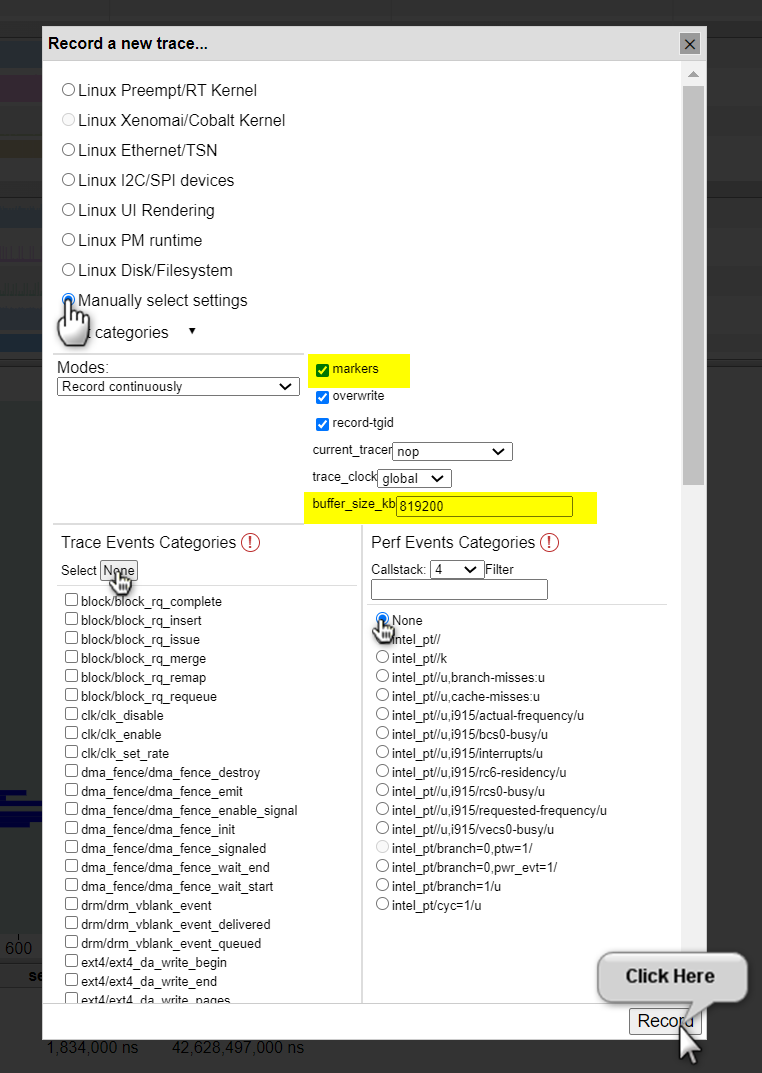
Click the Record button to begin capturing trace events. At this point, the Catapult user interface should show
Recording....On the OPC UA Client Benchmark HMI, enable tracing functionality by selecting the Enable tracing (debug) checkbox.
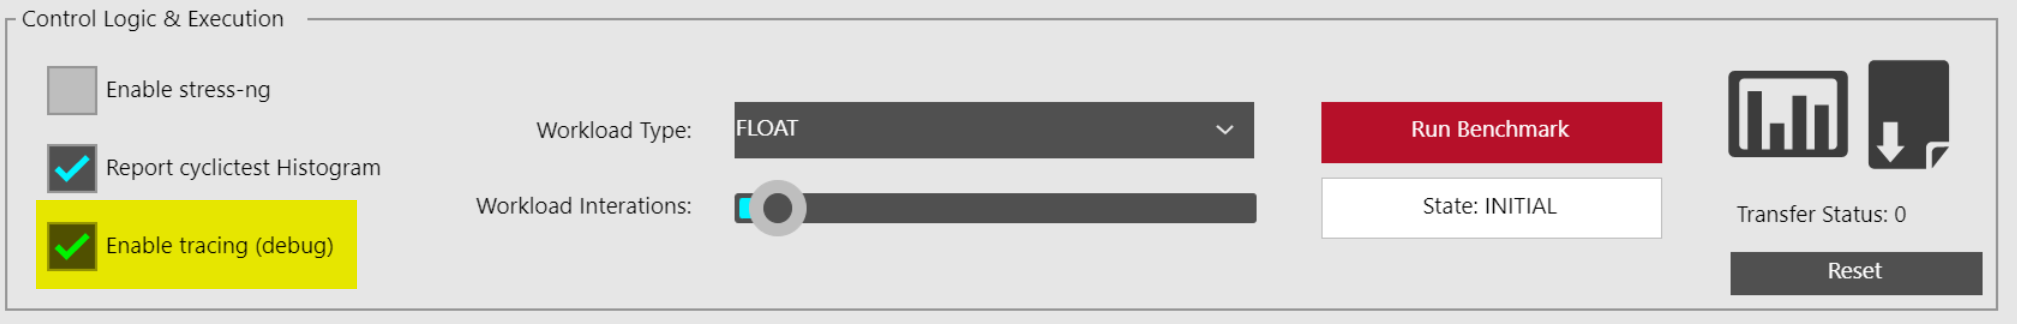
Execute the OPC UA Client Benchmark as you would normally.
Upon completion, the OPC UA Client Benchmark
Timing Metricsdiagram will contain values pertaining to the entire run.
Stop capturing trace events by clicking the Stop button in the Catapult user interface.
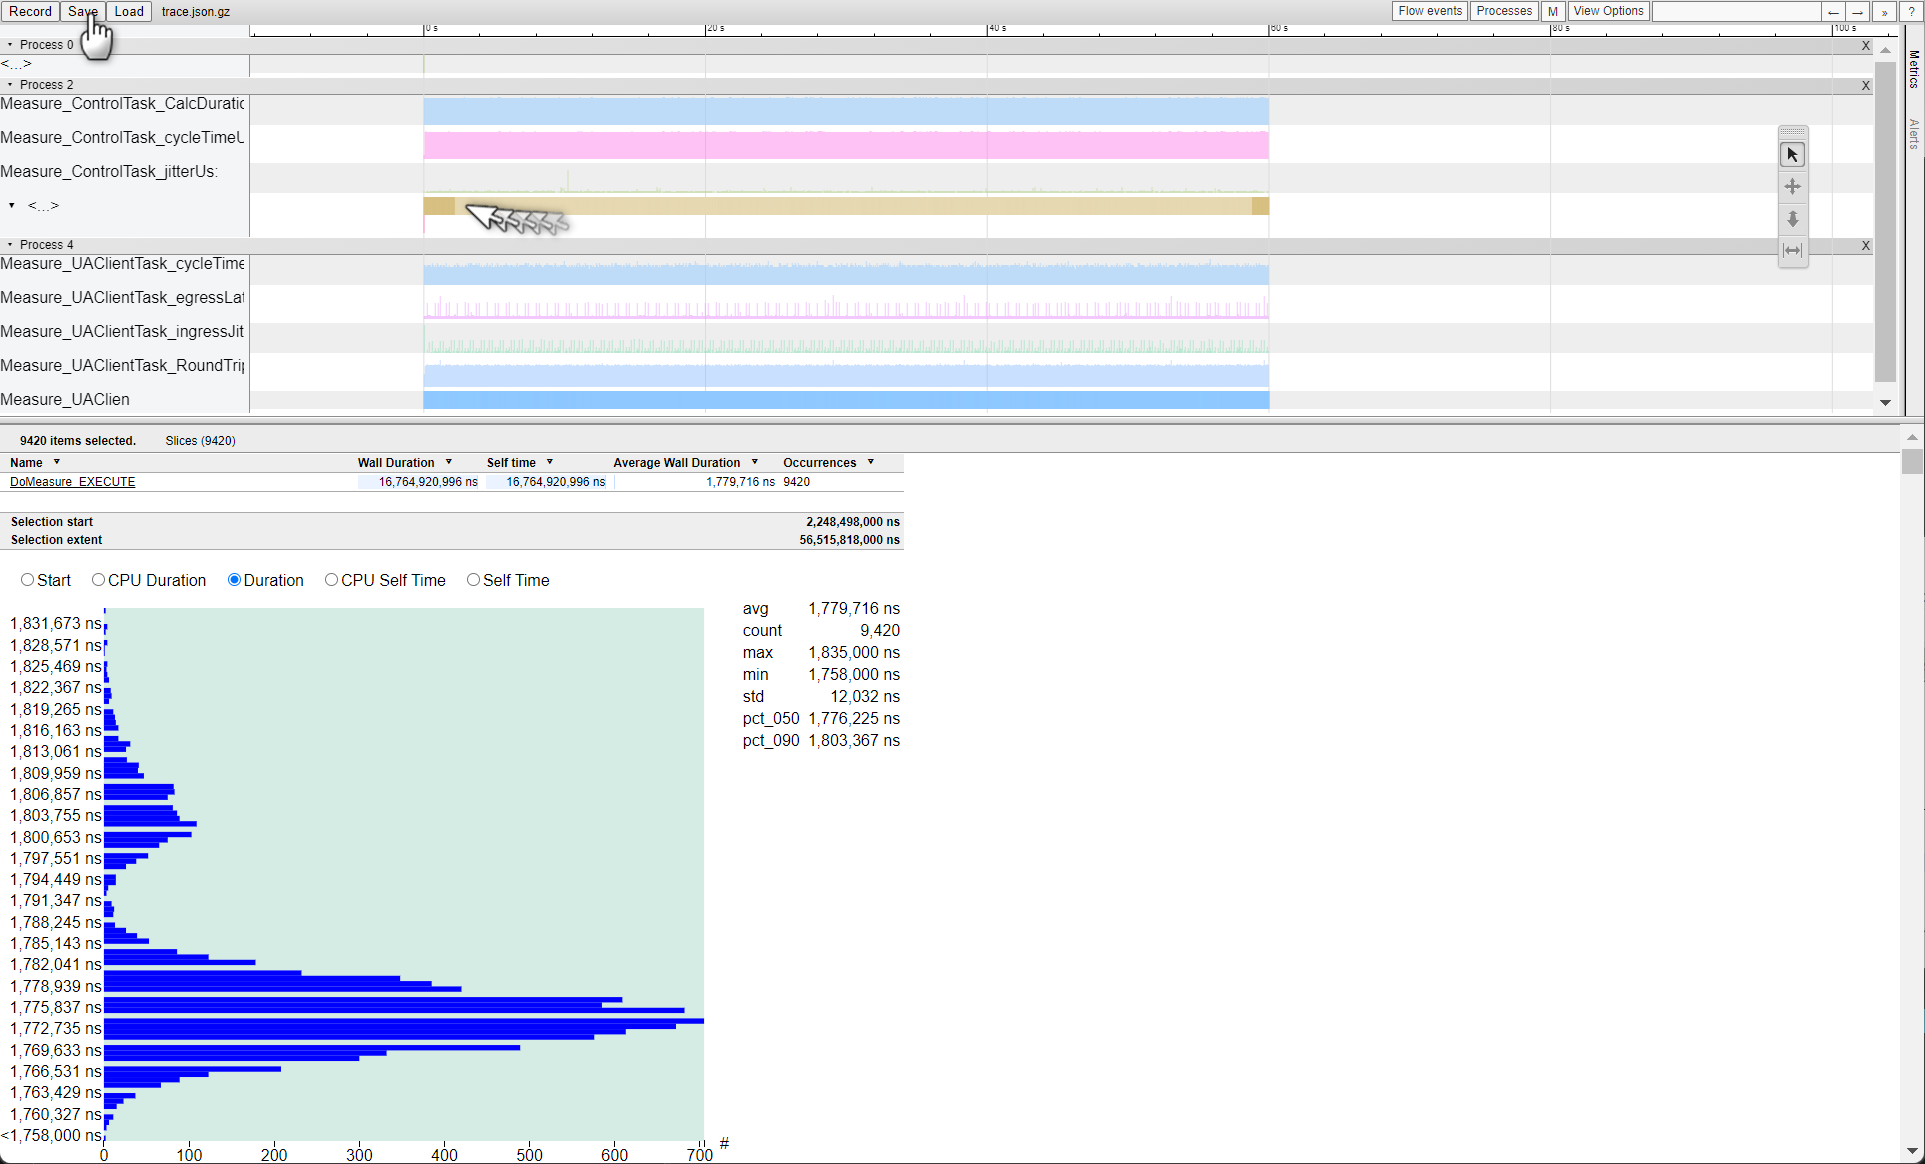
Export the capture by clicking the Save button. The capture can be reviewed at any time using the Offline Catapult trace viewer :
OPC UA Client Benchmark - Event Tracing (Network)
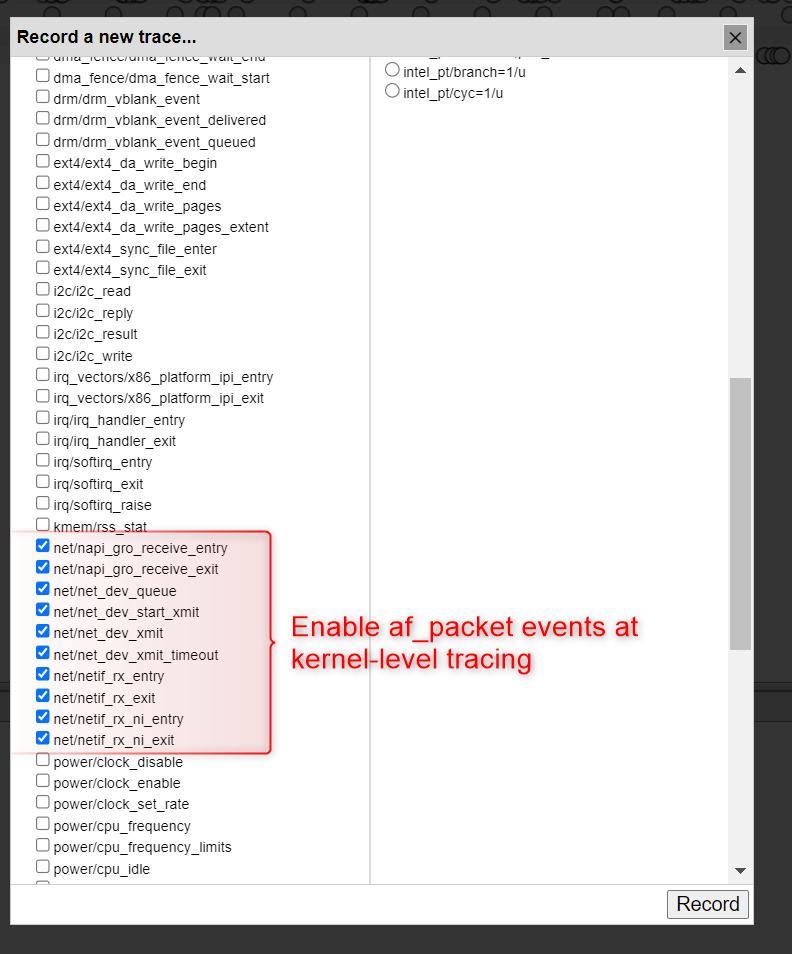
When executing the OPC UA Client Benchmark, it is useful to capture network trace events to better understand how data is transmitted over the network. These network trace events can be used to correlate data transmission to the CODESYS Linux runtime communication tasks. To capture network event traces, enable the netdev kernel events from the Catapult Record dialog box.
The following figure illustrates how egress and ingress TCP packets are correlated to the OPC UA Client Benchmark
Measure_ControlandMeasure_UAClienttasks: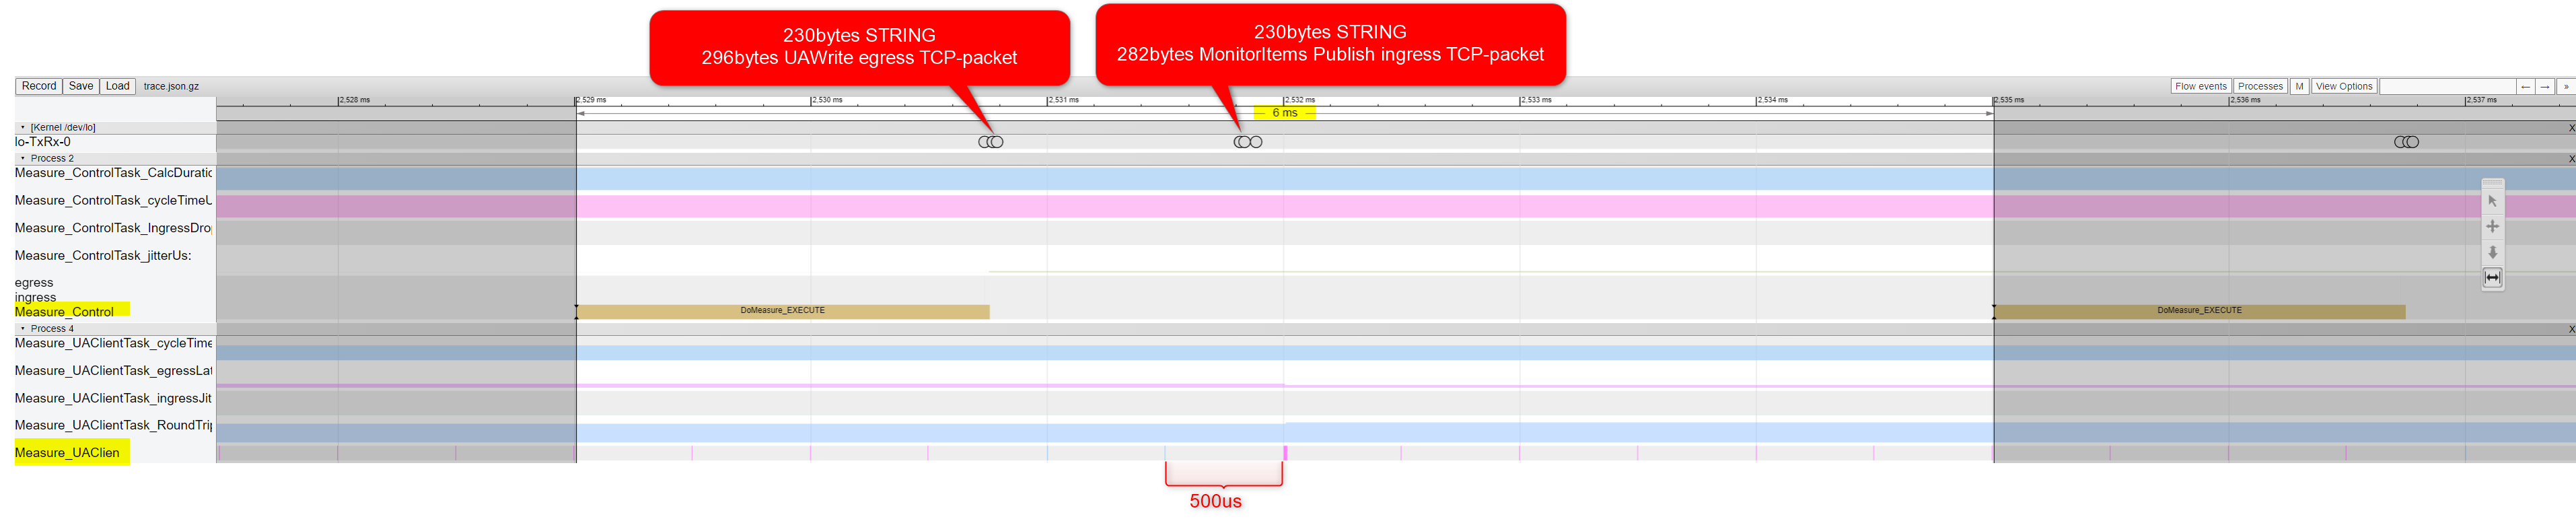
For more information on capturing and analyzing trace events, refer to Linux Events Tracing