Real-Time Compute Performance - DPDK
Benchmark |
Units |
Version |
Source |
|---|---|---|---|
Real-Time Compute Performance - DPDK |
Nanoseconds |
Follows version of dpdk |
Intel created |
About RTCP-DPDK Benchmark
The Real-Time Compute Performance (RTCP) Data Plane Development Kit (DPDK) benchmark measures the latency of round-trip network packets generated and processed by a simulated control cycle Applications. It utilizes Data Plane Development Kit (DPDK) to accelerate network packet processing. The performance of the workload is impacted by cache misses. Using Cache Allocation Technology improves application performance by assigning CPU affinity to cache ways, which can be dedicated to real-time applications.
Attention
This benchmark ONLY functions in tandem with the following Intel® Ethernet Controllers :
[Endpoint PCI
8086:125b] Intel® Ethernet Controller I226-LM for Time-Sensitive Networking (TSN)[Endpoint PCI
8086:15f2] Intel® Ethernet Controller I225-LM for Time-Sensitive Networking (TSN)[Ethernet PCI
8086:157b,8086:1533,…] Intel® Ethernet Controller I210-IT for Time-Sensitive Networking (TSN)
It records the round-trip time between a simulated control cell and measurement applications Layer-2 communication through Intel® Ethernet Controllers via direct Ethernet cable connection, to minimize packet travel time impact on the benchmark results.
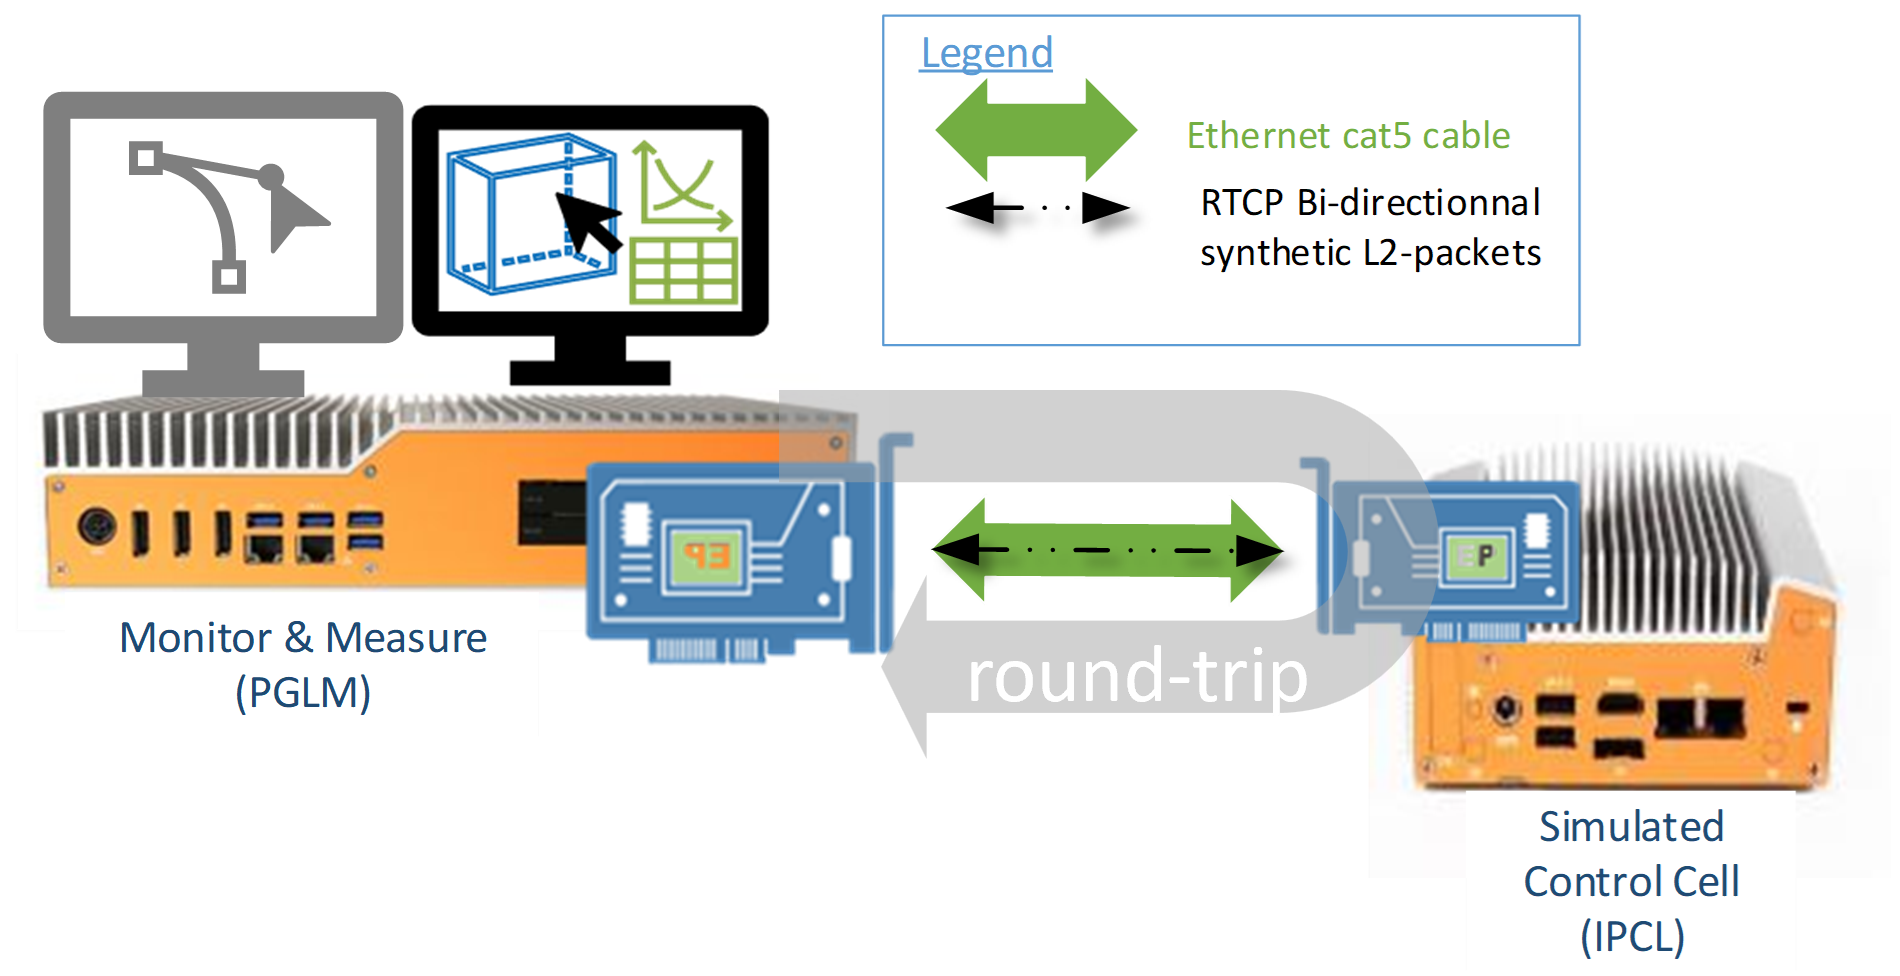
RTCP defines the following KPIs figures using Instructions Per Control Loop (IPCL) total bytes of instruction required per cycle to perform computation workload :
Observe Average Cycle-time = Moving average all all RTCP round-trip samples considering single RTCP round-trip time = single Observed Cycle-time
Observed MAX Cycle-time = RTCP worst round-trip time
Jitter = RTCP worst round-trip time – RTCP best round-trip time
Iteration run = Total number of RTCP round-trip time samples
Buffer KB size and Span KB size of Cyclical Workload Generator (GWLG) for a given Instructions Per Control Loop (IPCL) target SKU.
Table below show the recommended IPCL target to user-input buffer and span KB size ratio e.g. Buffer = IPCL * 22 :
Intel® Platform (codename)
IPCL target (K)
Buffer KB Size (user input)
Buffer KB Size (actual)
Span KB Size (user input)
Comments
EHL
5K
110
110
440
The Ratio
IPCL*22is precise. Span = Buffer x 4.25K
550
540
1080
The
IPCL*22Ratio is NOT precise. SoC Arch direct to use 540KB buffer. Span = Buffer x 2TGL
10K
220
220
880
The Ratio
IPCL*22is precise. Span = Buffer x 4.50K
1100
1080
2160
The
IPCL*22Ratio is NOT precise. SoC Arch direct to use 1080KB buffer. Span = Buffer x 2ADL, RPL
11K
242
242
968
The Ratio
IPCL*22is precise. Span = Buffer x 4.55K
1210
1188
2376
using buffer configuration
1180 KB * 1.1RatioIPCL*22is precise. Span = Buffer x 2ICL-D
12K
264
264
1056
The Ratio
IPCL*22is precise. Span = Buffer x 4.60K
1320
1296
2592
using buffer configuration
1180 KB * 1.2RatioIPCL*22is precise. Span = Buffer x 2Note
RTCP Observed cycle-time definition is a view-of-mind, which does not exactly translate to IEC61131-3 control task cycle-time and task deadline PLCopen standard definitions.
The first 10 RTCP round-trip time samples are generally removed from RTCP KPI measurements.
Install RTCP-DPDK
The RTCP-DPDK benchmark needs to be installed onto two target systems. You can install this component from the ECI repository. Setup the ECI repository, then perform either of the following commands to install this component:
![]()
- Install from meta-package
$ sudo dnf install eci-realtime-benchmarking
- Install from individual RPM package
$ sudo dnf install rtcp-dpdk pqos-helper stress-ng driverctl
Optionally, install
gnuplotto plot a graph:$ sudo dnf install -y https://dl.fedoraproject.org/pub/epel/epel-release-latest-9.noarch.rpm $ sudo rpm --import /etc/pki/rpm-gpg/RPM-GPG-KEY-EPEL-9 $ sudo dnf install -y gnuplot
Optionally, install
matplotlibto plot a jitter graph:$ sudo dnf install python3-pip -y $ pip3 install pandas matplotlib
Tip
You can minimize the installation size by configuring the DNF package manager to not install documentation or weak dependencies:
$ dnf config-manager --best --nodocs --setopt=install_weak_deps=False --save
![]()
![]()
This package is not yet available for Debian or Canonical® Ubuntu®.
- Install from meta-package
- Install from individual Deb package
Optionally, install
gnuplotto plot a graph:$ sudo apt install gnuplotOptionally, install
matplotlibto plot a jitter graph:$ sudo apt install python3-pandas python3-matplotlib
Execute RTCP-DPDK
The RTCP-DPDK benchmark will be executed twice. The first run will be without any optimizations and will help establish a baseline performance. The second run will be with optimizations and will help establish a maximum expected latency.
The RTCP-DPDK benchmark requires two systems. The first system generates Layer-2 traffic with DPDK offloading. The second system receives the traffic and adds timestamps. Install RTCP-DPDK on both systems. Locate the Ethernet port associated with the I225/I226 NIC on each system, and directly connect the I225/I226 of both systems together using an Ethernet cable.
Enable Intel IOMMU
For the benchmark to work correctly, the Input-Output Memory Management Unit (IOMMU) must be enabled. Edit the GRUB config on both systems to enable IOMMU:

Update the GRUB EFI boot configuration, then reboot:
$ sudo grubby --update-kernel=ALL --args="intel_iommu=on iommu=pt"
$ sudo grub2-mkconfig -o /etc/grub2.cfg
$ sudo systemctl reboot


Install ECI GRUB menu options:
$ sudo apt install customizations-grub
Modify the Linux kernel boot parameters for DPDK:
$ sudo echo 'echo "set eci_cmdline=\"\${eci_cmdline} intel_iommu=on iommu=pt \""' | sudo tee /etc/grub.d/07_eci-dpdk > /dev/null
$ sudo chmod +x /etc/grub.d/07_eci-dpdk
Update the GRUB EFI boot configuration, then reboot:
$ sudo update-grub
$ sudo systemctl reboot
Override the driver with vfio-pci
In order to use DPDK with the Intel I225/I226 Ethernet Controller, we need to override the device driver with
vfio-pci. This is done with thedriverctl. Usedriverctlto list the various network devices on the system.$ driverctl -v list-devices network
In this example, the I225 Ethernet Controller was attached to the
0000:01:00.0PCI slot:$ driverctl -v list-devices network 0000:01:00.0 igc (Ethernet Controller I225-LM)
Tip
If you don’t see Ethernet Controller I225-LM in the
driverctllist but you see0000:01:00.0 (none) [*] (), then you probably need to unset an existing override:$ sudo driverctl unset-override 0000:01:00.0
On both systems, override the I225/I226 driver. For example:
$ sudo driverctl set-override 0000:01:00.0 vfio-pci
Tip
If you receive error
driverctl: failed to bind device 0000:01:00.0 to driver vfio-pci, then you may need to enableVT-din BIOS, typically located atIntel Advanced Menu ⟶ System Agent (SA) Configuration.Verify that the VFIO driver was successfully loaded by listing the network devices with
driverctlagain:$ driverctl -v list-devices network
The
vfio-pcidriver should be bound to the I225 Ethernet Controller:$ driverctl -v list-devices network 0000:01:00.0 vfio-pci [*] (Ethernet Controller I225-LM)
Additionally, you may verify that the
vfio-pcidriver was successfully loaded by observing thedmesglogs:$ dmesg | tail -n 2 [ 436.424678] VFIO - User Level meta-driver version: 0.3 [ 436.443377] igc 0000:01:00.0 enp1s0: PHC removed
Disable RDPMC protection
On both systems, disable all Read Performance Monitoring Counters (RDPMC) protection so that the benchmarking tool can read the monitoring counters:
$ sudo bash -c "echo 2 > /sys/devices/cpu/rdpmc"
Note
On some systems, the path may be
/sys/devices/cpu_core/rdpmcinstead.Configure huge pages
To run the benchmark, we need to enable huge pages. We create 2,048 units of 2 MB huge pages for the NUMA node 0. Perform the following command on both systems:
$ sudo bash -c "echo 2048 > /sys/devices/system/node/node0/hugepages/hugepages-2048kB/nr_hugepages"
Increase thread runtime limit
The default values for the real-time throttling mechanism define that 95% of the CPU time can be used by real-time tasks. For this benchmark, we would like to reserve 100% of the CPU. Please note that configuring the runtime limit in this way can potentially lock a system if the workload in question contains unbounded polling loops. Use this configuration with caution. Increase the thread runtime limit to infinity by performing the following command on both systems:
$ sudo bash -c "echo -1 > /proc/sys/kernel/sched_rt_runtime_us"
See also
On the first system, run
stress-ngas a noisy neighbor to increase interrupts and cache evictions:The example below uses neighboring memory and compute stress on Core 4.
$ stress-ng --memcpy 4 --cpu 4
On the first system, run the Instructions Per Control Loop (IPCL) application with desired core
-cmask and using recommended-bbuffer size and-sspan size as described in the above section :The example below uses recommended buffer and span size for a target TGL SKU to achieve an approx 10K IPCL on Core 1.
$ sudo dpdk-ipcl -c 0x2 -n 2 -- -b 220KB -s 880KB -i 3/TSC,PMC,PKT/RR:49
On the second system, run the PGLM application with affinity desired core 1
-cmask and using recommended-bbuffer size and-sspan size as described in the above section :The example below uses recommended buffer and span size for a target TGL SKU to achieve an approx 10K IPCL on Core 1.
$ sudo dpdk-pglm -c 0x2 -n 2 -- -b 220KB -s 880KB
Wait a minute for the data to collect before stopping the benchmark on both systems by pressing Ctrl + c.
On the first system, there should be six
*.binfiles generated. We’re primarily interested in thepkt.binfile since it contains the network round-trip latency measurements.$ ls *.bin pkt.bin pmc0.bin pmc1.bin pmc2.bin pmc3.bin tsc.bin
Parse the generated data into a comma delimited text file:
$ dpdk-rt-parser pkt.bin output.csv
Calculate maximum, average, and minimum statistics
Save the linked AWK script to a file named
statistics.awk:statistics.awkExecute the AWK script with the
output.csvfile as an input parameter:$ awk -f statistics.awk output.csv
The script should output calculations for maximum, average, and minimum. These values represent the round-trip latency in nanoseconds for the benchmark to process, transmit & receive data between the two systems. Ideally, the values should be low (i.e. less than 100000ns) and consistent (i.e. the maximum and minimum are close in value). The False Positive count the number of round-trip cycle invalid samples (e.g. time-line discontinuity).
$ awk -f statistic.awk output.csv

NOTE: entries that have zeros are dropped from analysis.
Number of entries that were blank or zero: 0
Analysis begins at line : 10
--------------------------
 Iteration run : 18935
 Observed MAX Cycle-time : 260468
 Observed Avg Cycle-time : 57856.4
 Jitter : 202796
--------------------------
False positive : 15
OPTIONAL - Extract the data points and plot a graph
If you would like to visualize the data, you may optionally graph it using
gnuplot.Graph the data using
gnuplot( False Positive round-trip cycle invalid samples being ignored) :$ cat <<'EOF' > rtcp-dpdk.plot set term png set out 'rtcp-dpdk-result.png' set datafile separator ',' set ylabel "Latency (nanoseconds) set xlabel "Sample Number" upper_limit = 1000000000 set yrange [10000:1000000] plot 'output.csv' using ($1>upper_limit? 1/0:$1) with lines EOF $ gnuplot -p rtcp-dpdk.plot
You should have a PNG image file named
rtcp-dpdk-result.pngwhich you can view with a typical image viewer.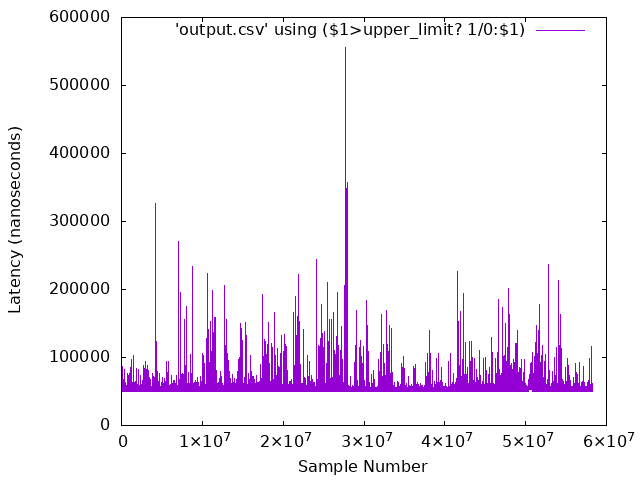
OPTIONAL - Extract the packet jitter plot a graph
If you would like to visualize the data (OPTIONAL: remove first 10 rows of outliers), you may optionally graph it using
matplotlib.$ dpdk-rt-parser pkt.bin rtcp-dpdk-pkt-jitter.csv $ python3 ./seq_hist.py --noconfidential -t "DPDK rte_ethdev L2-Packet round-trip latency" --ymin 1000 --maxline rtcp-dpdk-pkt-jitter.csv
Save the linked Python script to a file named
seq_hist.py:seq_hist.pyYou should have a PNG image file named
rtcp-dpdk-pkt-jitter.pngwhich you can view with a typical image viewer.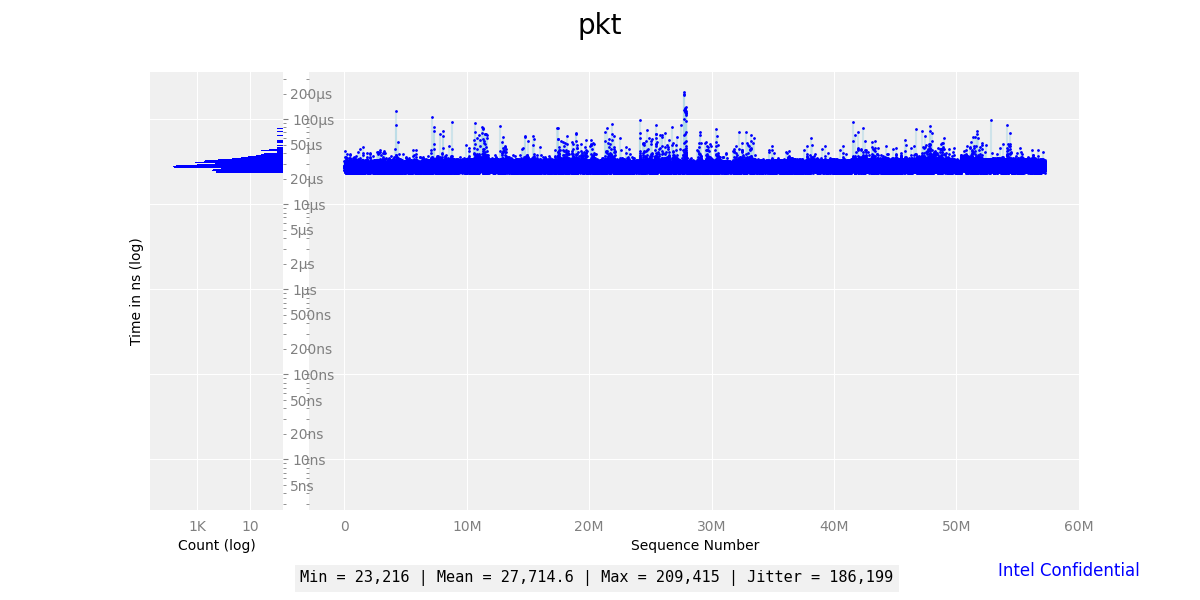
This concludes the first half of the benchmark, which was executed without any optimizations. The second half will introduce optimizations which will improve performance. Begin the second half by modifying the Linux kernel boot parameters on both systems:
$ sudo grubby --update-kernel=ALL --args="hpet=disable clocksource=tsc tsc=reliable intel_pstate=disable intel_idle.max_cstate=0 intel.max_cstate=0 processor.max_cstate=0 processor_idle.max_cstate=0 rcupdate.rcu_cpu_stall_suppress=1 mce=off nmi_watchdog=0 nosoftlockup noht numa_balancing=disable hugepages=1024 rcu_nocb_poll audit=0 irqaffinity=0 isolcpus=1-3 rcu_nocbs=1-3 nohz_full=1-3 i915.enable_dc=0 i915.disable_power_well=0"
$ sudo grub2-mkconfig -o /etc/grub2.cfg
See also
These ECI Kernel Boot Optimizations are recommended for any system where determinism is critical.
The ECI GRUB menu entry should already contain the recommended kernel boot parameters since the
customizations-grubDeb package was installed previously. Verify that the kernel boot parameters are correct:$ cat /proc/cmdline
The following kernel boot parameters should be present:
intel_iommu=on iommu=pt console=ttyS0,115200 console=tty0 clocksource=tsc tsc=reliable art=virtallow no_ipi_broadcast=1 nosoftlockup efi=runtime numa_balancing=disable hugepages=1024 audit=0 nmi_watchdog=0 irqaffinity=0 mce=off hpet=disable rcupdate.rcu_cpu_stall_suppress=1 rcu_nocb_poll noht isolcpus=1-3 rcu_nocbs=1-3 nohz_full=1-3 intel_pstate=disable intel.max_cstate=0 intel_idle.max_cstate=0 processor.max_cstate=0 processor_idle.max_cstate=0 i915.force_probe=* i915.enable_rc6=0 i915.enable_dc=0 i915.disable_power_well=0 igb.blacklist=noSee also
These ECI Kernel Boot Optimizations are recommended for any system where determinism is critical.
Reboot both systems and modify their BIOS configurations according to Recommended ECI BIOS Optimizations. Make sure
VT-dis set toEnabledotherwise thevfio-pcidriver will not be loadable.$ sudo systemctl reboot
Perform the same steps from the first run (see: Execute RTCP-DPDK), but stop before executing the benchmark applications
dpdk-ipclanddpdk-pglm. This time, will we execute the applications usingpqos-helperto utilize Cache Allocation Technology. On the first system, run the Instructions Per Control Loop (IPCL) application. Thepqos-helperis segmenting the CPU cache and assigning a small block (0x000f) to cores 0, 2, 3, and a large block (0xfff0) to core 1. The core mask0x2passed todpdk-ipcltargets core 1, which is isolated and assigned a large block of the CPU cache.Instructions Per Control Loop (IPCL) is set with recommended
-bbuffer size and-sspan size as described in the above section :The example below uses recommended buffer and span size for a target TGL SKU to achieve an approx 10K IPCL on Core 1.
$ test_core=$(cat /sys/devices/system/cpu/isolated | cut -d '-' -f1 | cut -d ',' -f1)
$ sudo /opt/pqos/pqos-helper.py --cos0 0x000f --cos2 0xfff0 --assign_cos "0=0 0=2 0=3 2=${test_core:-1}" --pqos_rst --pqos_msr --command "dpdk-ipcl -c 0x$(printf '%x' $((${test_core:-1}*2))) -n 2 -- -b 220KB -s 880KB -i 3/TSC,PMC,PKT/RR:49"
On the second system, run the PGLM application:
The example below uses recommended buffer and span size for a target TGL SKU to achieve an approx 10K IPCL on Core 1.
$ test_core=$(cat /sys/devices/system/cpu/isolated | cut -d '-' -f1 | cut -d ',' -f1)
$ sudo /opt/pqos/pqos-helper.py --cos0 0x000f --cos2 0xfff0 --assign_cos "0=0 0=2 0=3 2=${test_core:-1}" --pqos_rst --pqos_msr --command "dpdk-pglm -c 0x$(printf '%x' $((${test_core:-1}*2))) -n 2 -- -b 220KB -s 880KB"
Wait a minute for the data to collect before stopping the benchmark on both systems by pressing Ctrl + c.
On the first system, there should be six
*.binfiles generated. We’re primarily interested in thepkt.binfile since it contains the sample latency measurements.$ ls *.bin pkt.bin pmc0.bin pmc1.bin pmc2.bin pmc3.bin tsc.bin
Parse the generated data into a comma delimited text file:
$ dpdk-rt-parser pkt.bin output.csv
Calculate maximum, average, and minimum statistics
Execute the same AWK script from the first run with the
output.csvfile as an input parameter:$ awk -f statistics.awk output.csv
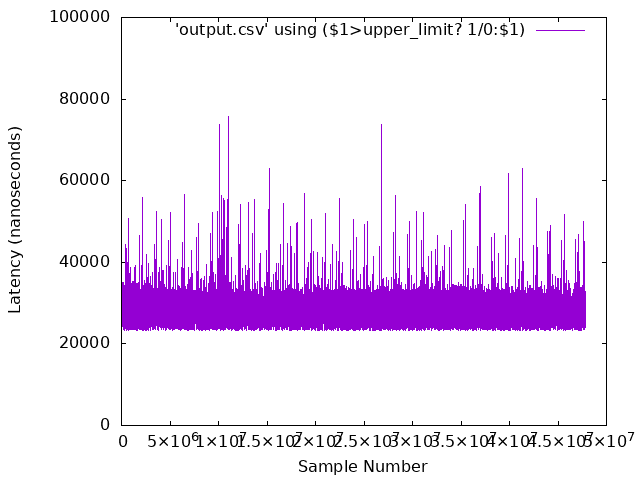
The script should round-trip time output calculations for maximum, average, and jitter. These values represent the round-trip latency in nanoseconds for the benchmark to process, transmit & receive data between the two systems. Ideally, the values should be low (i.e. less than 100000ns) and consistent (i.e. the maximum and minimum are close in value).
$ awk -f statistic.awk output.csv

NOTE: entries that have zeros are dropped from analysis.
Number of entries that were blank or zero: 0
Analysis begins at line : 10
--------------------------
 Iteration run : 47833121
 Observed MAX Cycle-time : 75811
 Observed Avg Cycle-time : 27733.6
 Jitter : 52566
--------------------------
Compare the results from the first run to the second run. The second run should have eliminated the spurious spikes and on average lower latency values due to the use of Cache Allocation Technology and various Linux kernel boot optimizations.
Reset thread runtime limit
Since it’s generally not recommended to persist the thread runtime limit at infinity for uncharacterized workloads, restore the thread runtime limit back to its default value of 95%. This will prevent potential lock-ups if a workload with an unbounded polling loop happens to execute. Restore the thread runtime limit to its default value by performing the following command on both systems:
$ sudo bash -c "echo 950000 > /proc/sys/kernel/sched_rt_runtime_us"
Interpret RTCP-DPDK Results
The benchmark measures the round-trip latency in nanoseconds of network packets sent between two systems. Each measurement encompasses the time needed to process, transmit and receive the data over the network. Ideally, the values should be as low (i.e. less than 100000ns) and consistent (i.e. the maximum and minimum are close in value). When the maximum and minimum values are not close, this indicates that the system is not optimized and/or the benchmark application is not isolated. Performance can typically be improved by applying Recommended ECI BIOS Optimizations, assigning the application affinity to an isolated core (see ECI Kernel Boot Optimizations), and utilizing Cache Allocation Technology to prevent cache eviction.