Benchmark Data
Important
Performance varies by use, configuration and other factors. Learn more at https://intel.com/PerformanceIndex.
Performance results are based on testing as of dates shown in configurations and may not reflect all publicly available updates. See configuration disclosure for details. No product or component can be absolutely secure.
Your costs and results may vary.
Intel technologies may require enabled hardware, software or service activation.
The following section is applicable to:

Benchmark Platforms
Intel® Core™ i7-1185GRE Processor
Unless otherwise stated, results obtained for the Intel® Core™ i7-1185GRE Processor were performed on the following system:
Manufacturer
Vecow*
MPN
SPC-7100
Processor
Intel® Core™ i7-1185GRE Processor
1.8 GHz to 4.4 GHz
15W TDP
Memory
32 GB DDR4
OS
ECI core-jammy
Intel Atom® x6425RE Processor
Unless otherwise stated, results obtained for the Intel Atom® x6425RE Processor were performed on the following system:
Manufacturer
ASRock*
MPN
Processor
Intel Atom® x6425RE Processor
1.9 GHz
12W TDP
Memory
16 GB DDR4
OS
ECI core-jammy
48-Hour Benchmark Results
The 48-Hour Benchmark has been used to evaluate the performance of a few systems. The 48-Hour Benchmark utilizes the following workloads with and without Cache Allocation Technology:
Caterpillar - The Caterpillar benchmark measures the execution time variation of a memory test workload. The performance of the workload is impacted by cache misses. Using Cache Allocation Technology improves application performance by assigning CPU affinity to cache ways, which can be dedicated to real-time applications.
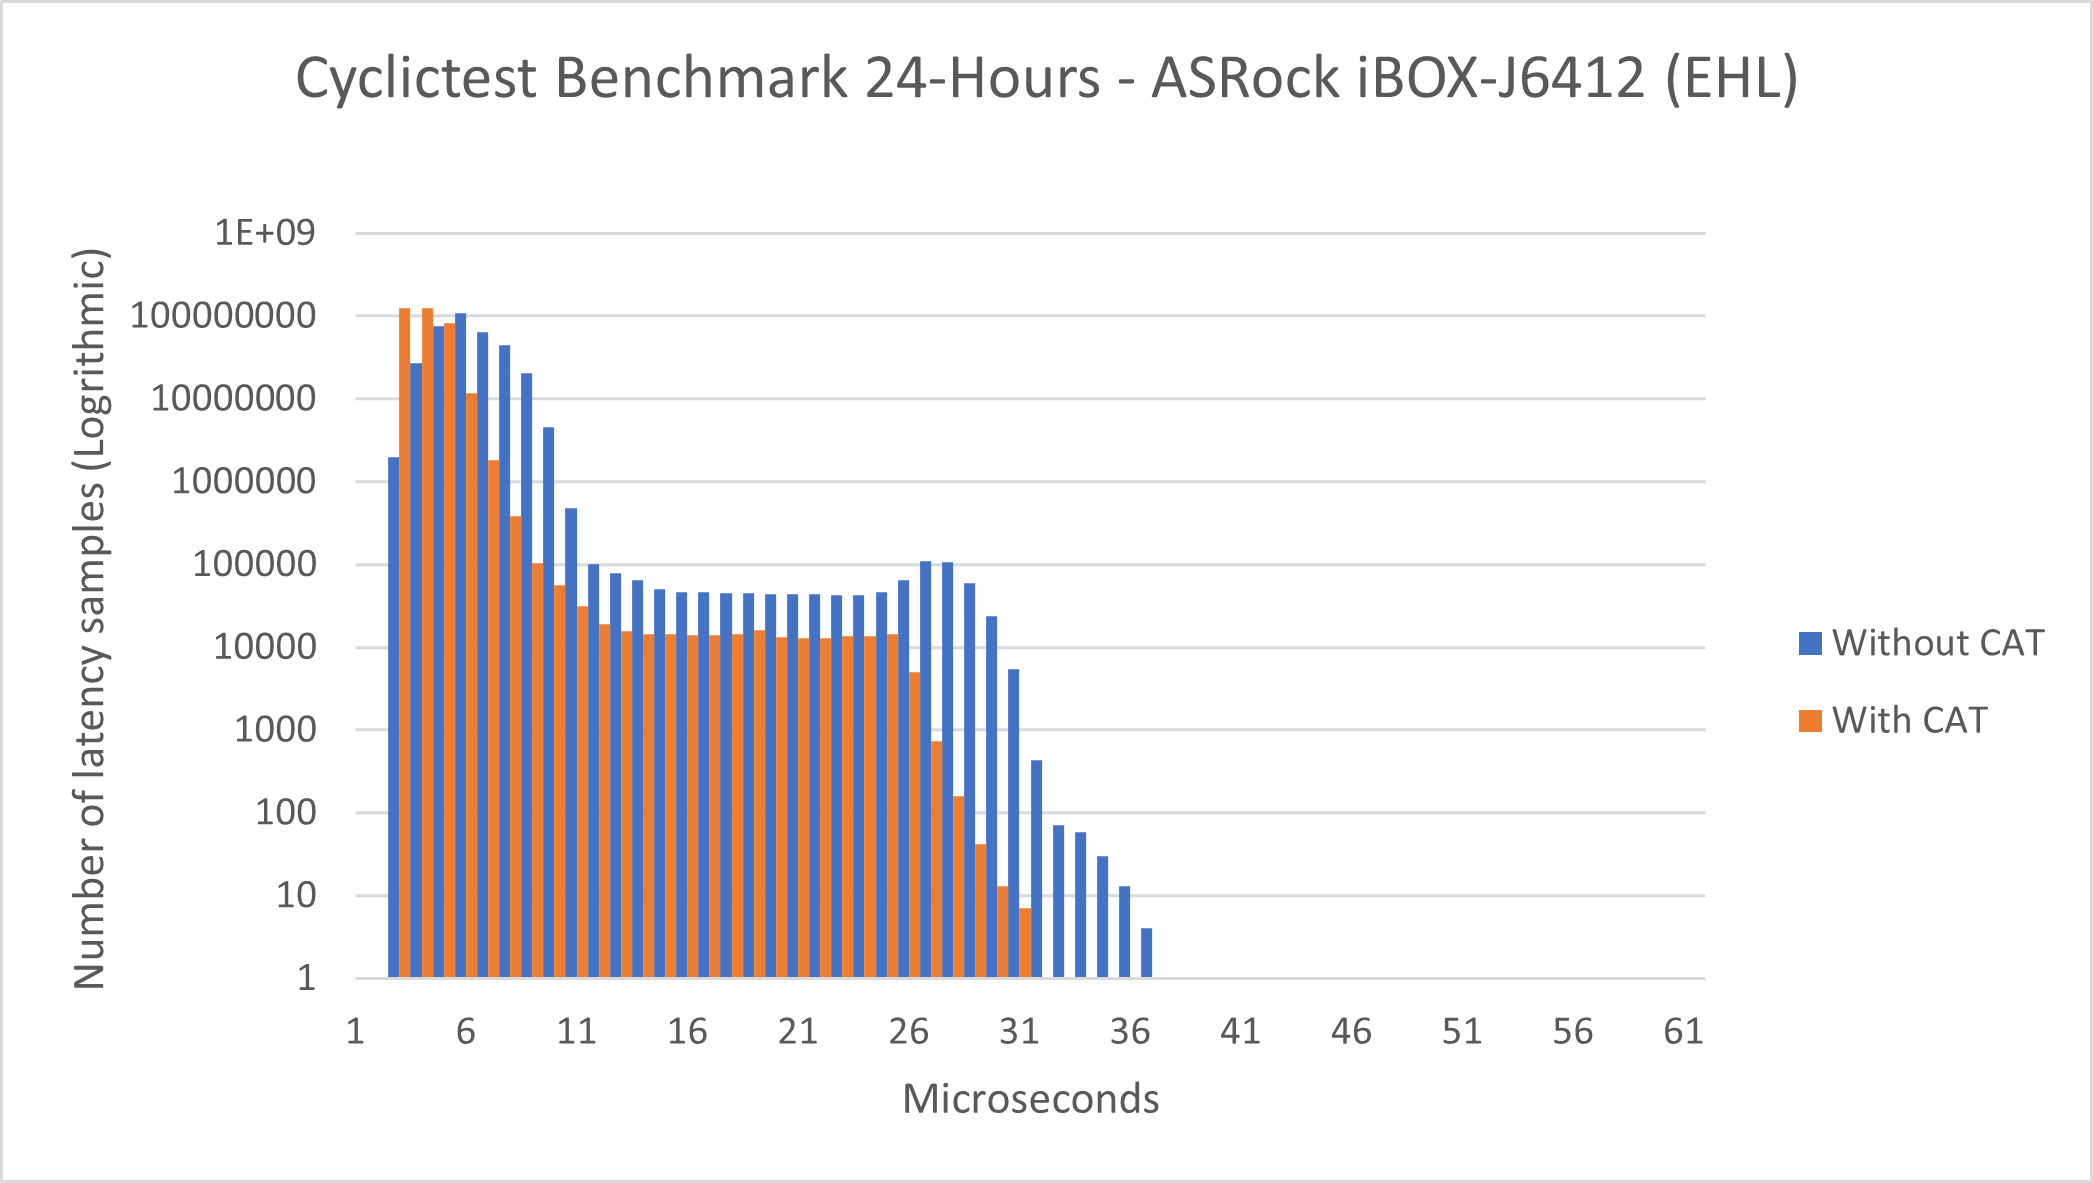
Cyclictest Workload - Cyclictest is most commonly used for benchmarking real-time (RT) systems. It is one of the most frequently used tools for evaluating the relative performance of an RT. Cyclictest accurately and repeatedly measures the difference between a thread’s intended wake-up time and the time at which it actually wakes up to provide statistics about the system’s latency. It can measure latency in real-time systems caused by the hardware, the firmware, and the operating system.
The data shown below demonstrates the advantage of Cache Allocation Technology when executing real-time workloads.
See also
See section 48-Hour Benchmark for more information about this benchmark.
The following configurations were used:
- Caterpillar without Cache Allocation Technology
Benchmark: Caterpillar
Benchmark Affinity: Core 3
Benchmark Priority:
chrt 99Noisy Neighbor: stress-ng
memcpyNoisy Neighbor Affinity: 0
Duration: ~3 hours
Cache Allocation Technology Enabled: No
- Caterpillar with Cache Allocation Technology
Benchmark: Caterpillar
Benchmark Affinity: Core 3
Benchmark Priority:
chrt 99Noisy Neighbor: stress-ng
memcpyNoisy Neighbor Affinity: Core 0
Duration: ~3 hours
Cache Allocation Technology Enabled: Yes (
COS0=0x0f→ Cores 0-2,COS3=0xf0→ Core 3)
- Cyclictest without Cache Allocation Technology
Benchmark: Cyclictest Workload with interval of 250μs
Benchmark Affinity: Core 3
Benchmark Priority:
chrt 99Noisy Neighbor: stress-ng
memcpyNoisy Neighbor Affinity: Core 0
Duration: 24 hours
Cache Allocation Technology Enabled: No
- Cyclictest with Cache Allocation Technology
Benchmark: Cyclictest Workload with interval of 250μs
Benchmark Affinity: Core 3
Benchmark Priority:
chrt 99Noisy Neighbor: stress-ng
memcpyNoisy Neighbor Affinity: Core 0
Duration: 24 hours
Cache Allocation Technology Enabled: Yes (
COS0=0x0f→ Cores 0-2,COS1=0xf0→ Core 3)
Intel® Core™ i7-1185GRE Processor - Caterpillar
See also
See section Caterpillar for more information about this benchmark.
![]()
This benchmark data was collected on core-jammy in a native environment.
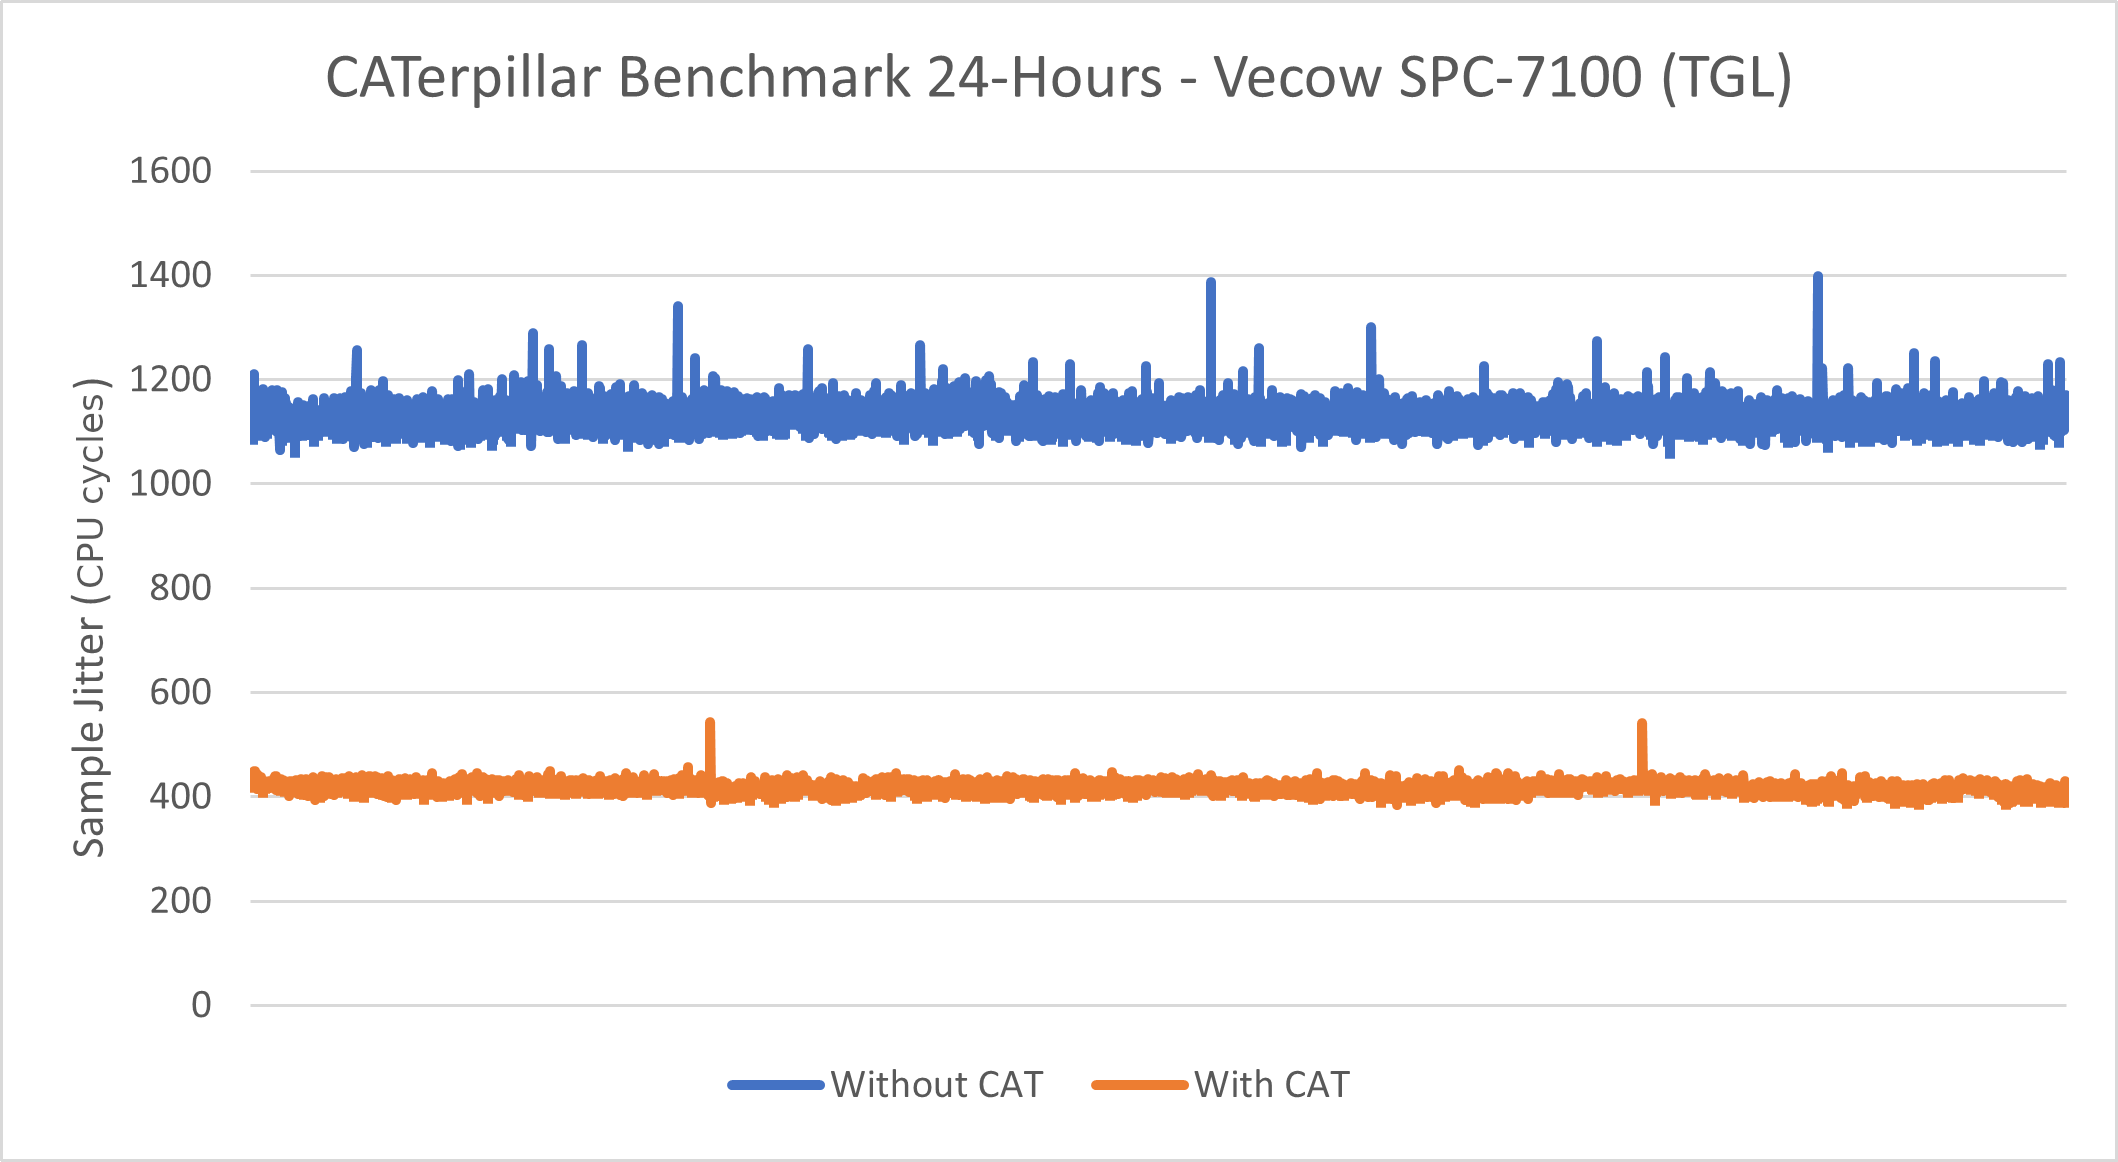
Without CAT |
With CAT |
|
|---|---|---|
Minimum Sample Jitter (CPU Cycles) |
1062 |
385 |
Maximum Sample Jitter (CPU Cycles) |
1398 |
543 |
Standard Deviation (CPU Cycles) |
21.89 |
8.89 |
Intel® Atom x6425RE Processor - Caterpillar
See also
See section Caterpillar for more information about this benchmark.
![]()
This benchmark data was collected on core-jammy in a native environment.
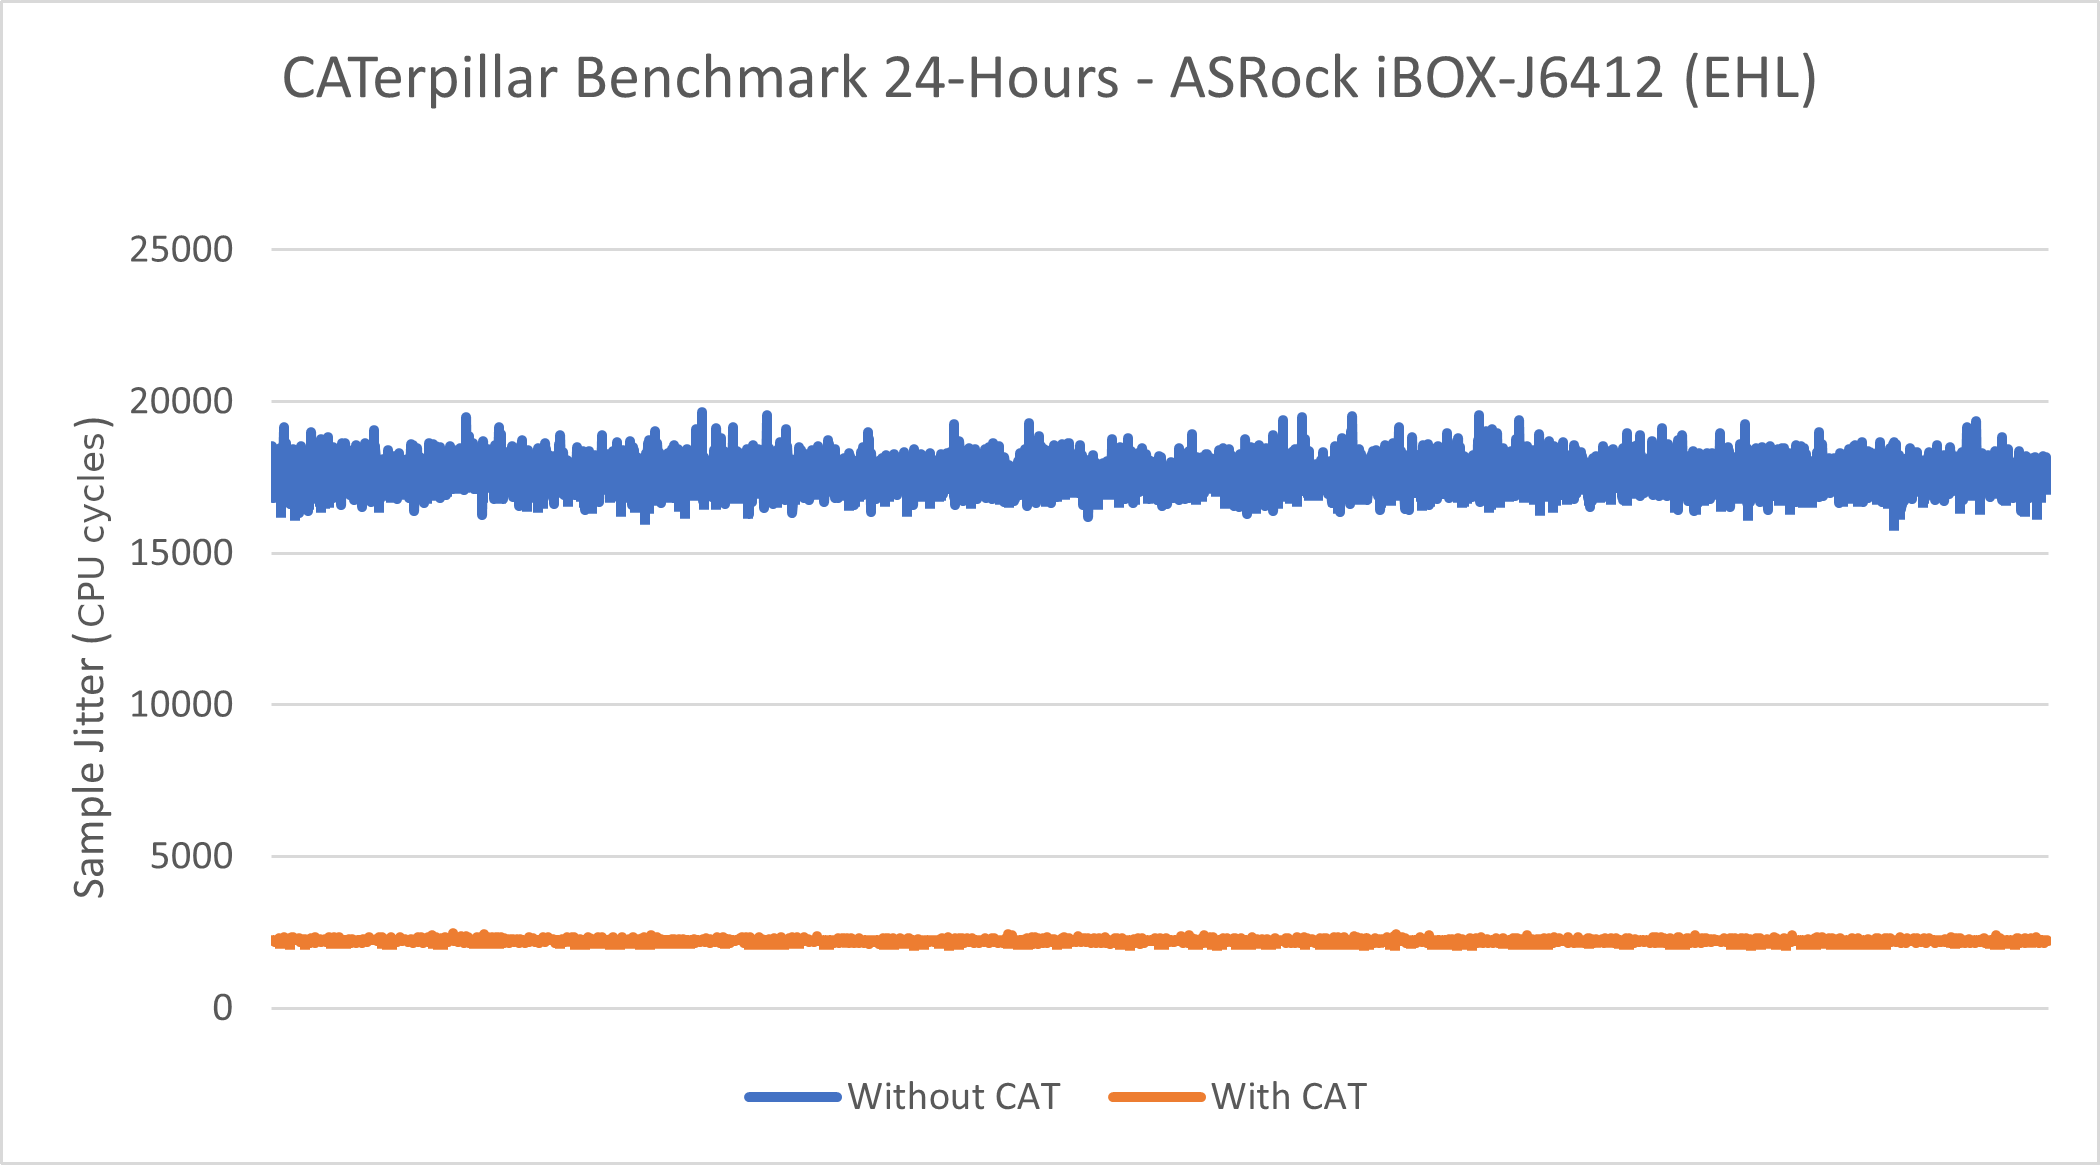
Without CAT |
With CAT |
|
|---|---|---|
Minimum Sample Jitter (CPU Cycles) |
15958 |
2109 |
Maximum Sample Jitter (CPU Cycles) |
19658 |
2490 |
Standard Deviation (CPU Cycles) |
446.09 |
31.29 |
Intel® Core™ i7-1185GRE Processor - Cyclictest
See also
See section Cyclictest Workload for more information about this benchmark.
![]()
This benchmark data was collected on core-jammy in a native environment.
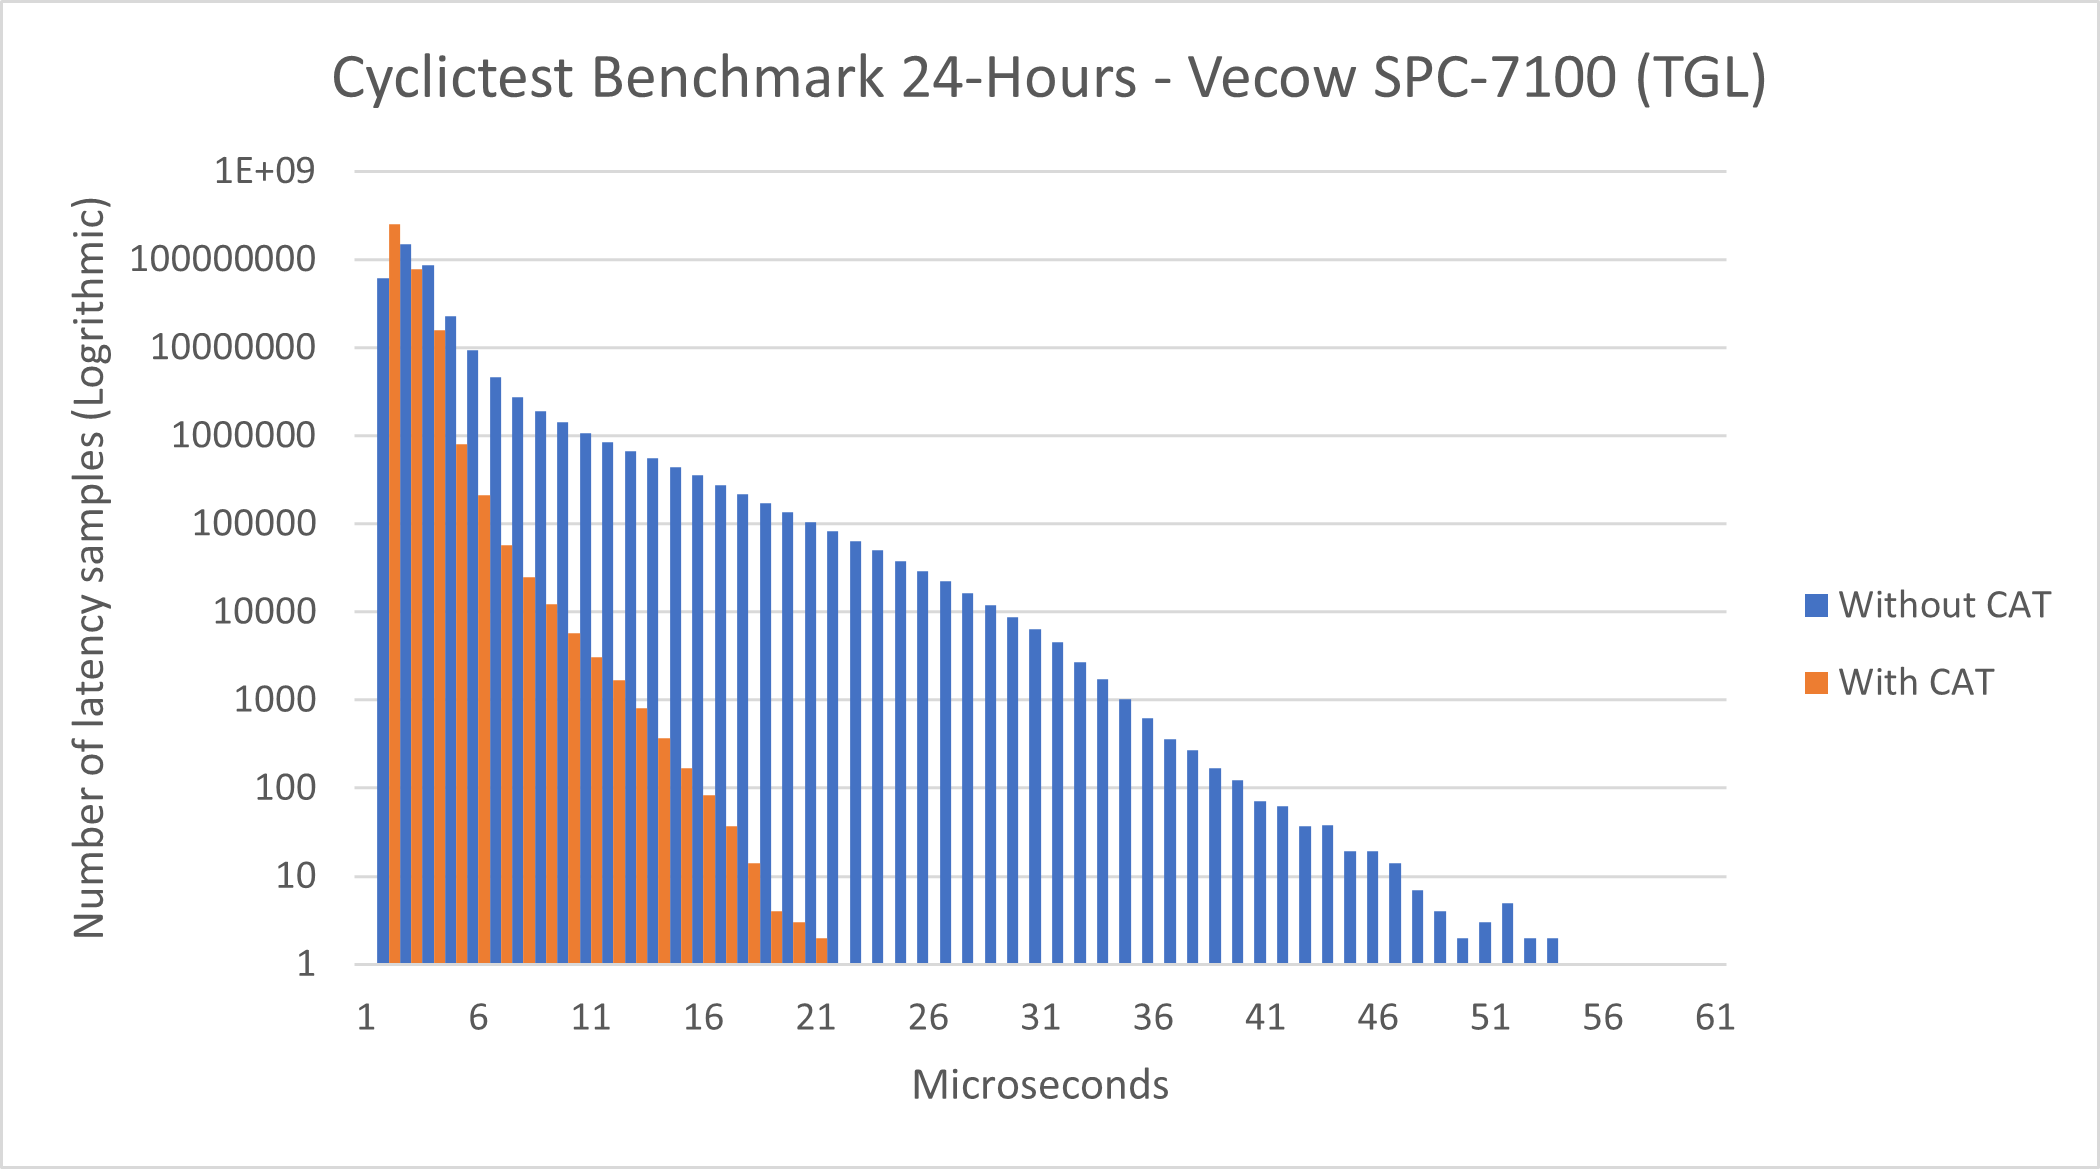
Without CAT |
With CAT |
|
|---|---|---|
Total Samples |
345600000 |
345600000 |
Minimum Latencies (μs) |
00001 |
0000` |
Average Latencies (μs) |
00002 |
00001 |
Maximum Latencies (μs) |
00055 |
00022 |
Intel® Atom x6425RE Processor - Cyclictest
![]()
This benchmark data was collected on core-jammy in a native environment.
See also
See section Cyclictest Workload for more information about this benchmark.
Without CAT |
With CAT |
|
|---|---|---|
Total Samples |
345600000 |
345600000 |
Minimum Latencies (μs) |
00002 |
00002 |
Average Latencies (μs) |
00005 |
00002 |
Maximum Latencies (μs) |
00036 |
00036 |
CODESYS OPC UA Client Benchmark Results
See also
See section CODESYS OPC UA Client Benchmark for more information about this benchmark.
Intel® Core™ i7-1185GRE Processor - CODESYS OPC UA Client
![]()
This benchmark data was collected on Red Hat® Enterprise Linux® 9.3 (Plow) in a container environment using the following runtime configuration:
Publishing Interval |
10 ms |
|---|---|
Monitored Item |
Int32 |
Workload Type |
FLOAT |
Workload Iterations |
10001 |
Stress-ng |
Disabled |
Cyclictest |
Disabled |
Tracing |
Disabled |
This benchmark was performed on a single-node configuration and a dual-node configuration. For the dual-node configuration, the nodes were connected via a standard Ethernet network. The results are summarized in the tabs below:
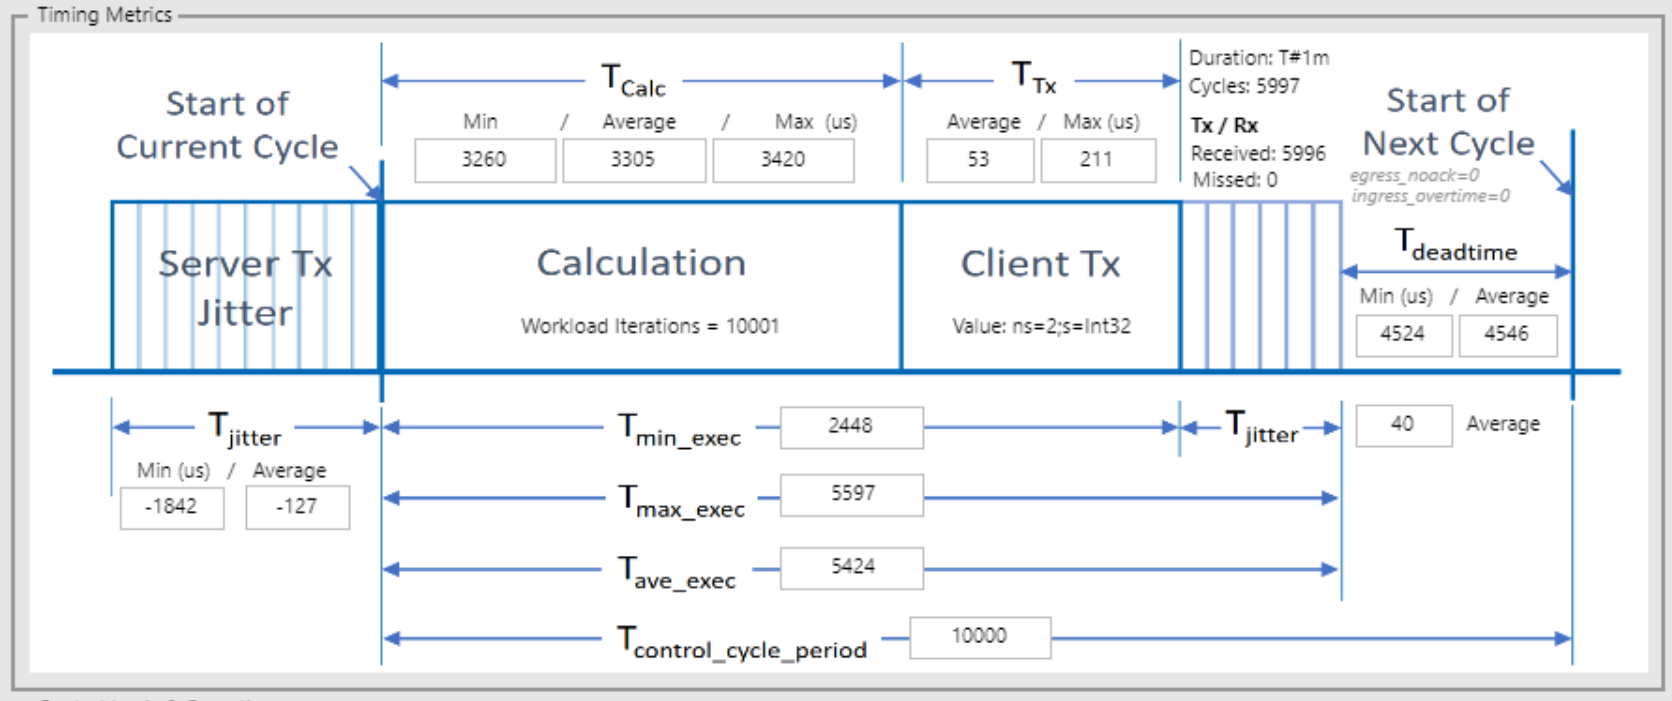
Control Cycle Period (μs) |
10000 |
|---|---|
Transmitted Packets - Total |
5996 |
Transmitted Packets - Missed |
0 |
Calculation Time - Minimum (μs) |
3260 |
Calculation Time - Maximum (μs) |
3420 |
Calculation Time - Average (μs) |
3305 |
Execution Time - Minimum (μs) |
2448 |
Execution Time - Maximum (μs) |
5597 |
Execution Time - Average (μs) |
5597 |
Execution Time Jitter - Average (μs) |
40 |
Client Transmit Time - Average (μs) |
52 |
Client Transmit Time - Maximum (μs) |
211 |
Server Transmit Jitter - Minimum (μs) |
-1842 |
Server Transmit Jitter - Average (μs) |
-127 |
Dead time - Minimum (μs) |
4524 |
Dead time - Average (μs) |
4546 |
The full data report is available to download here: codesys-opc-ua-client_single_tgl.zip
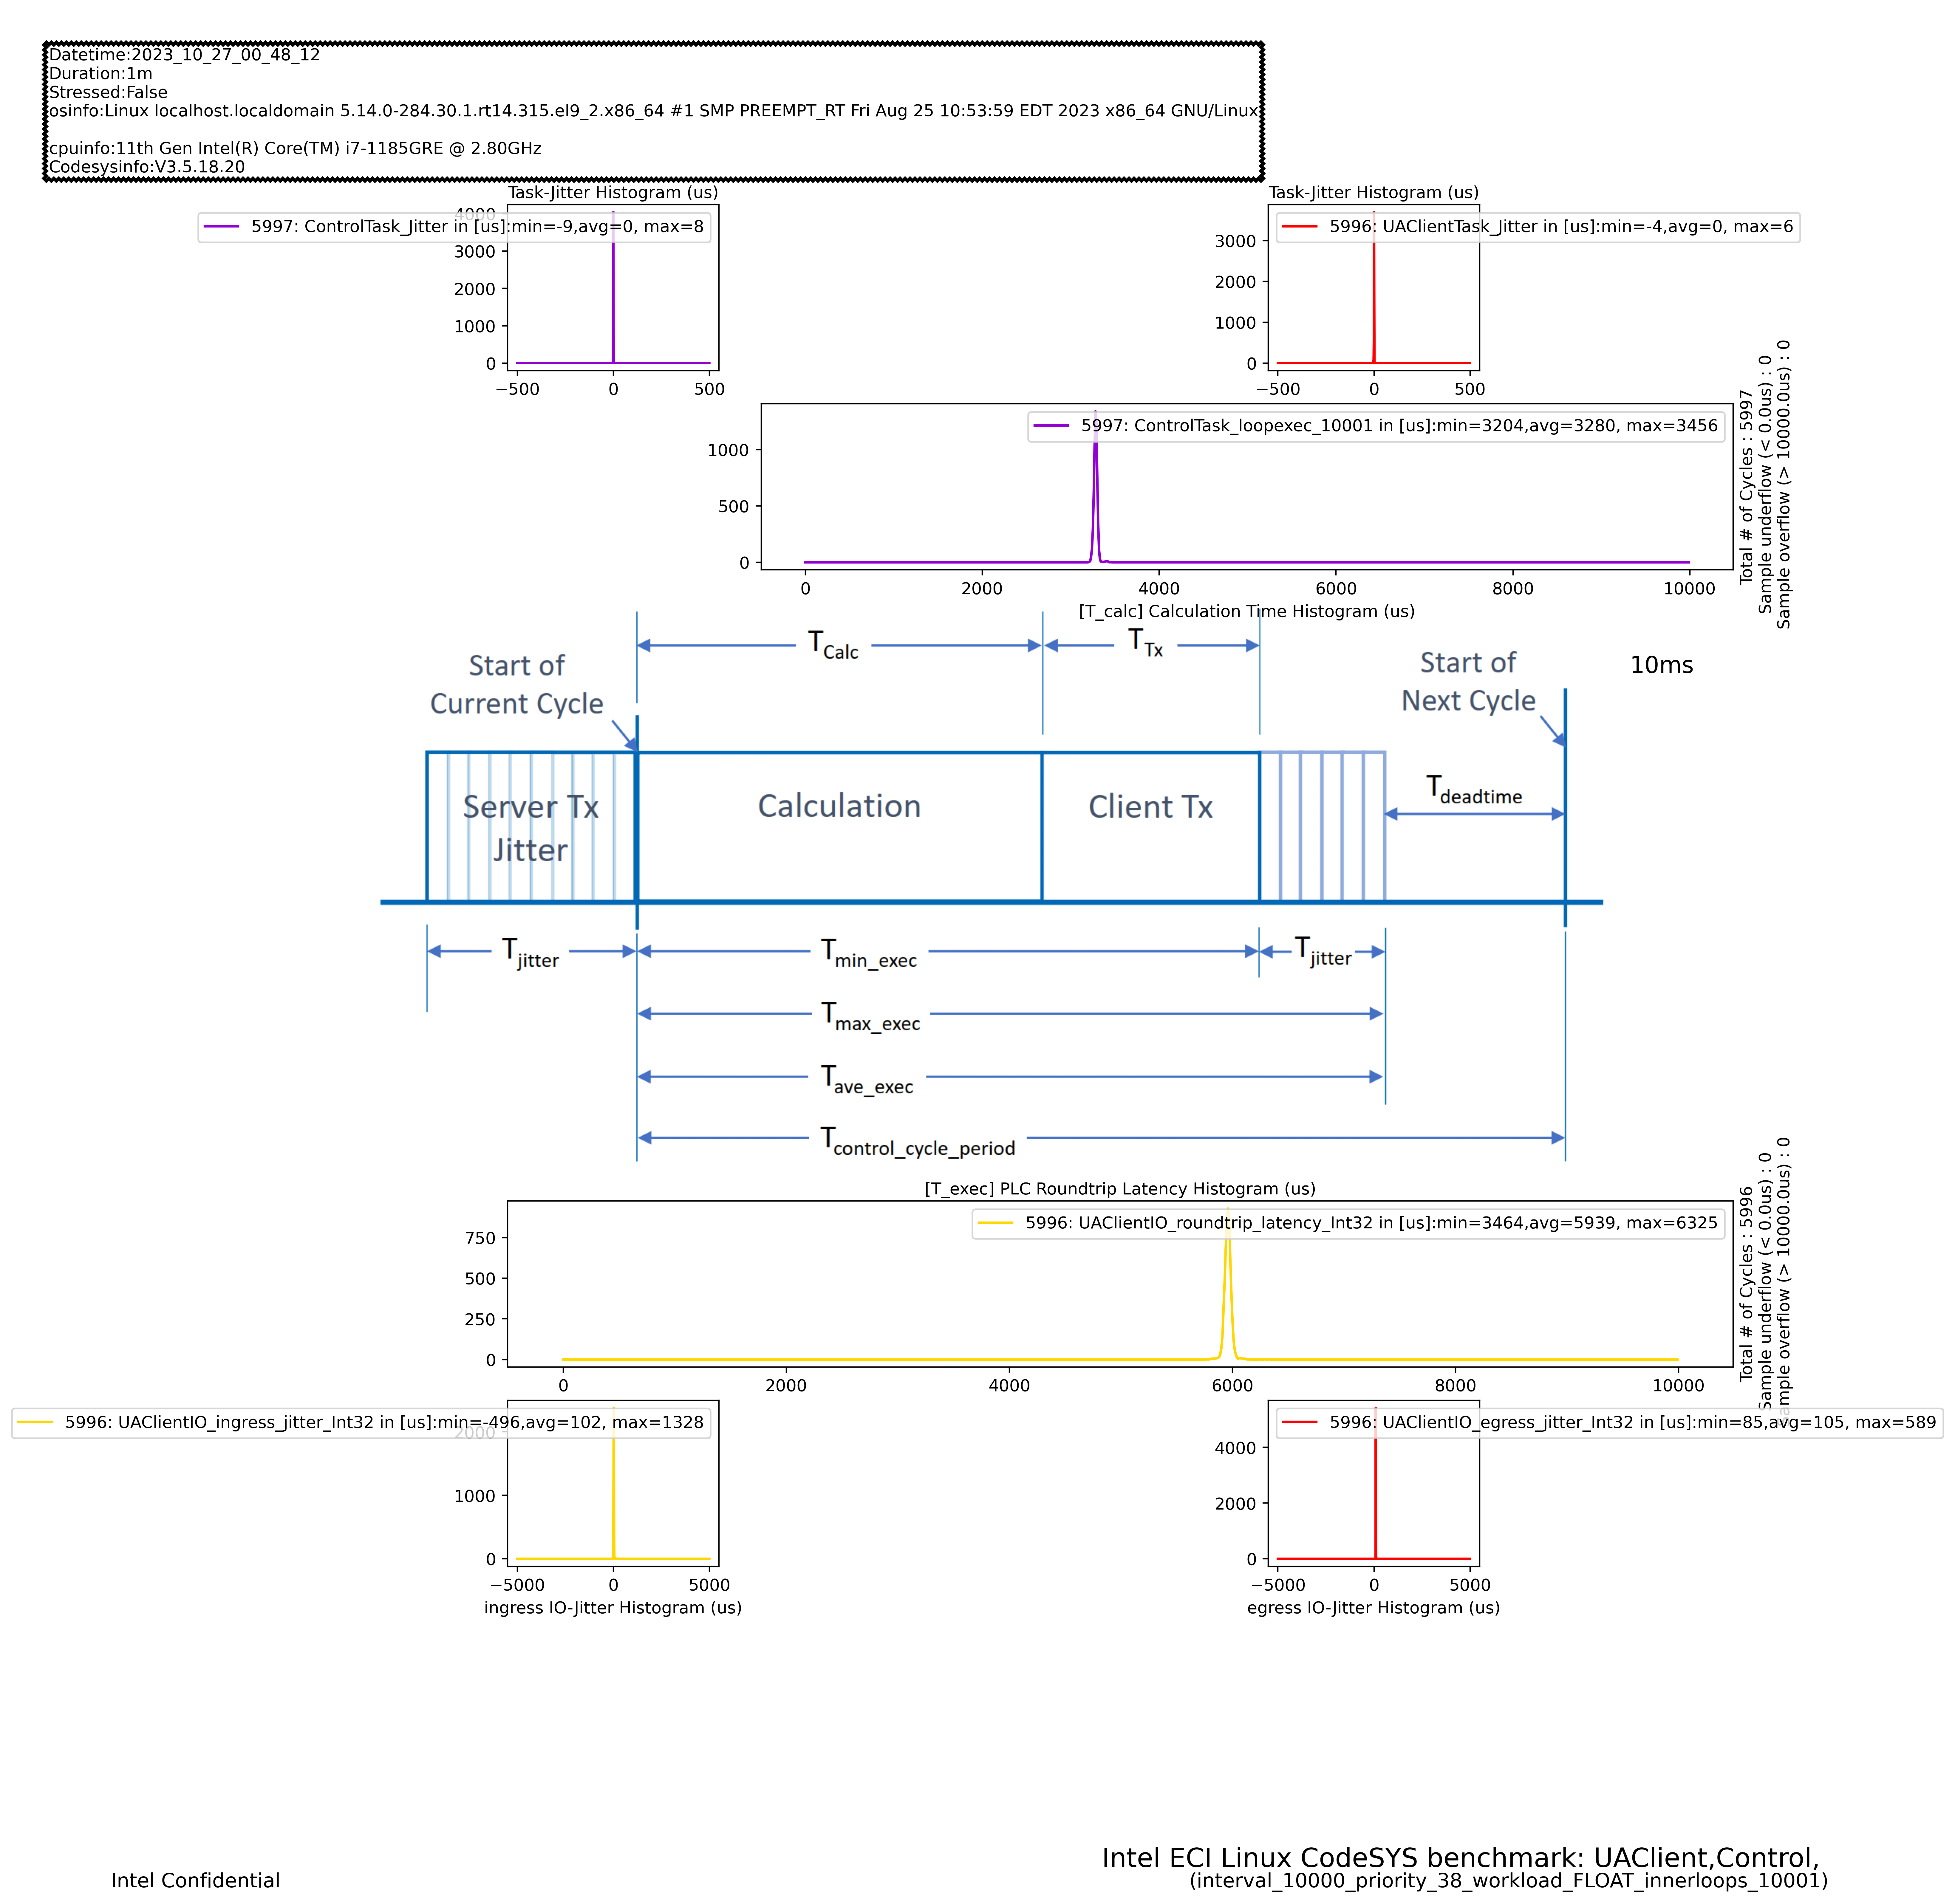
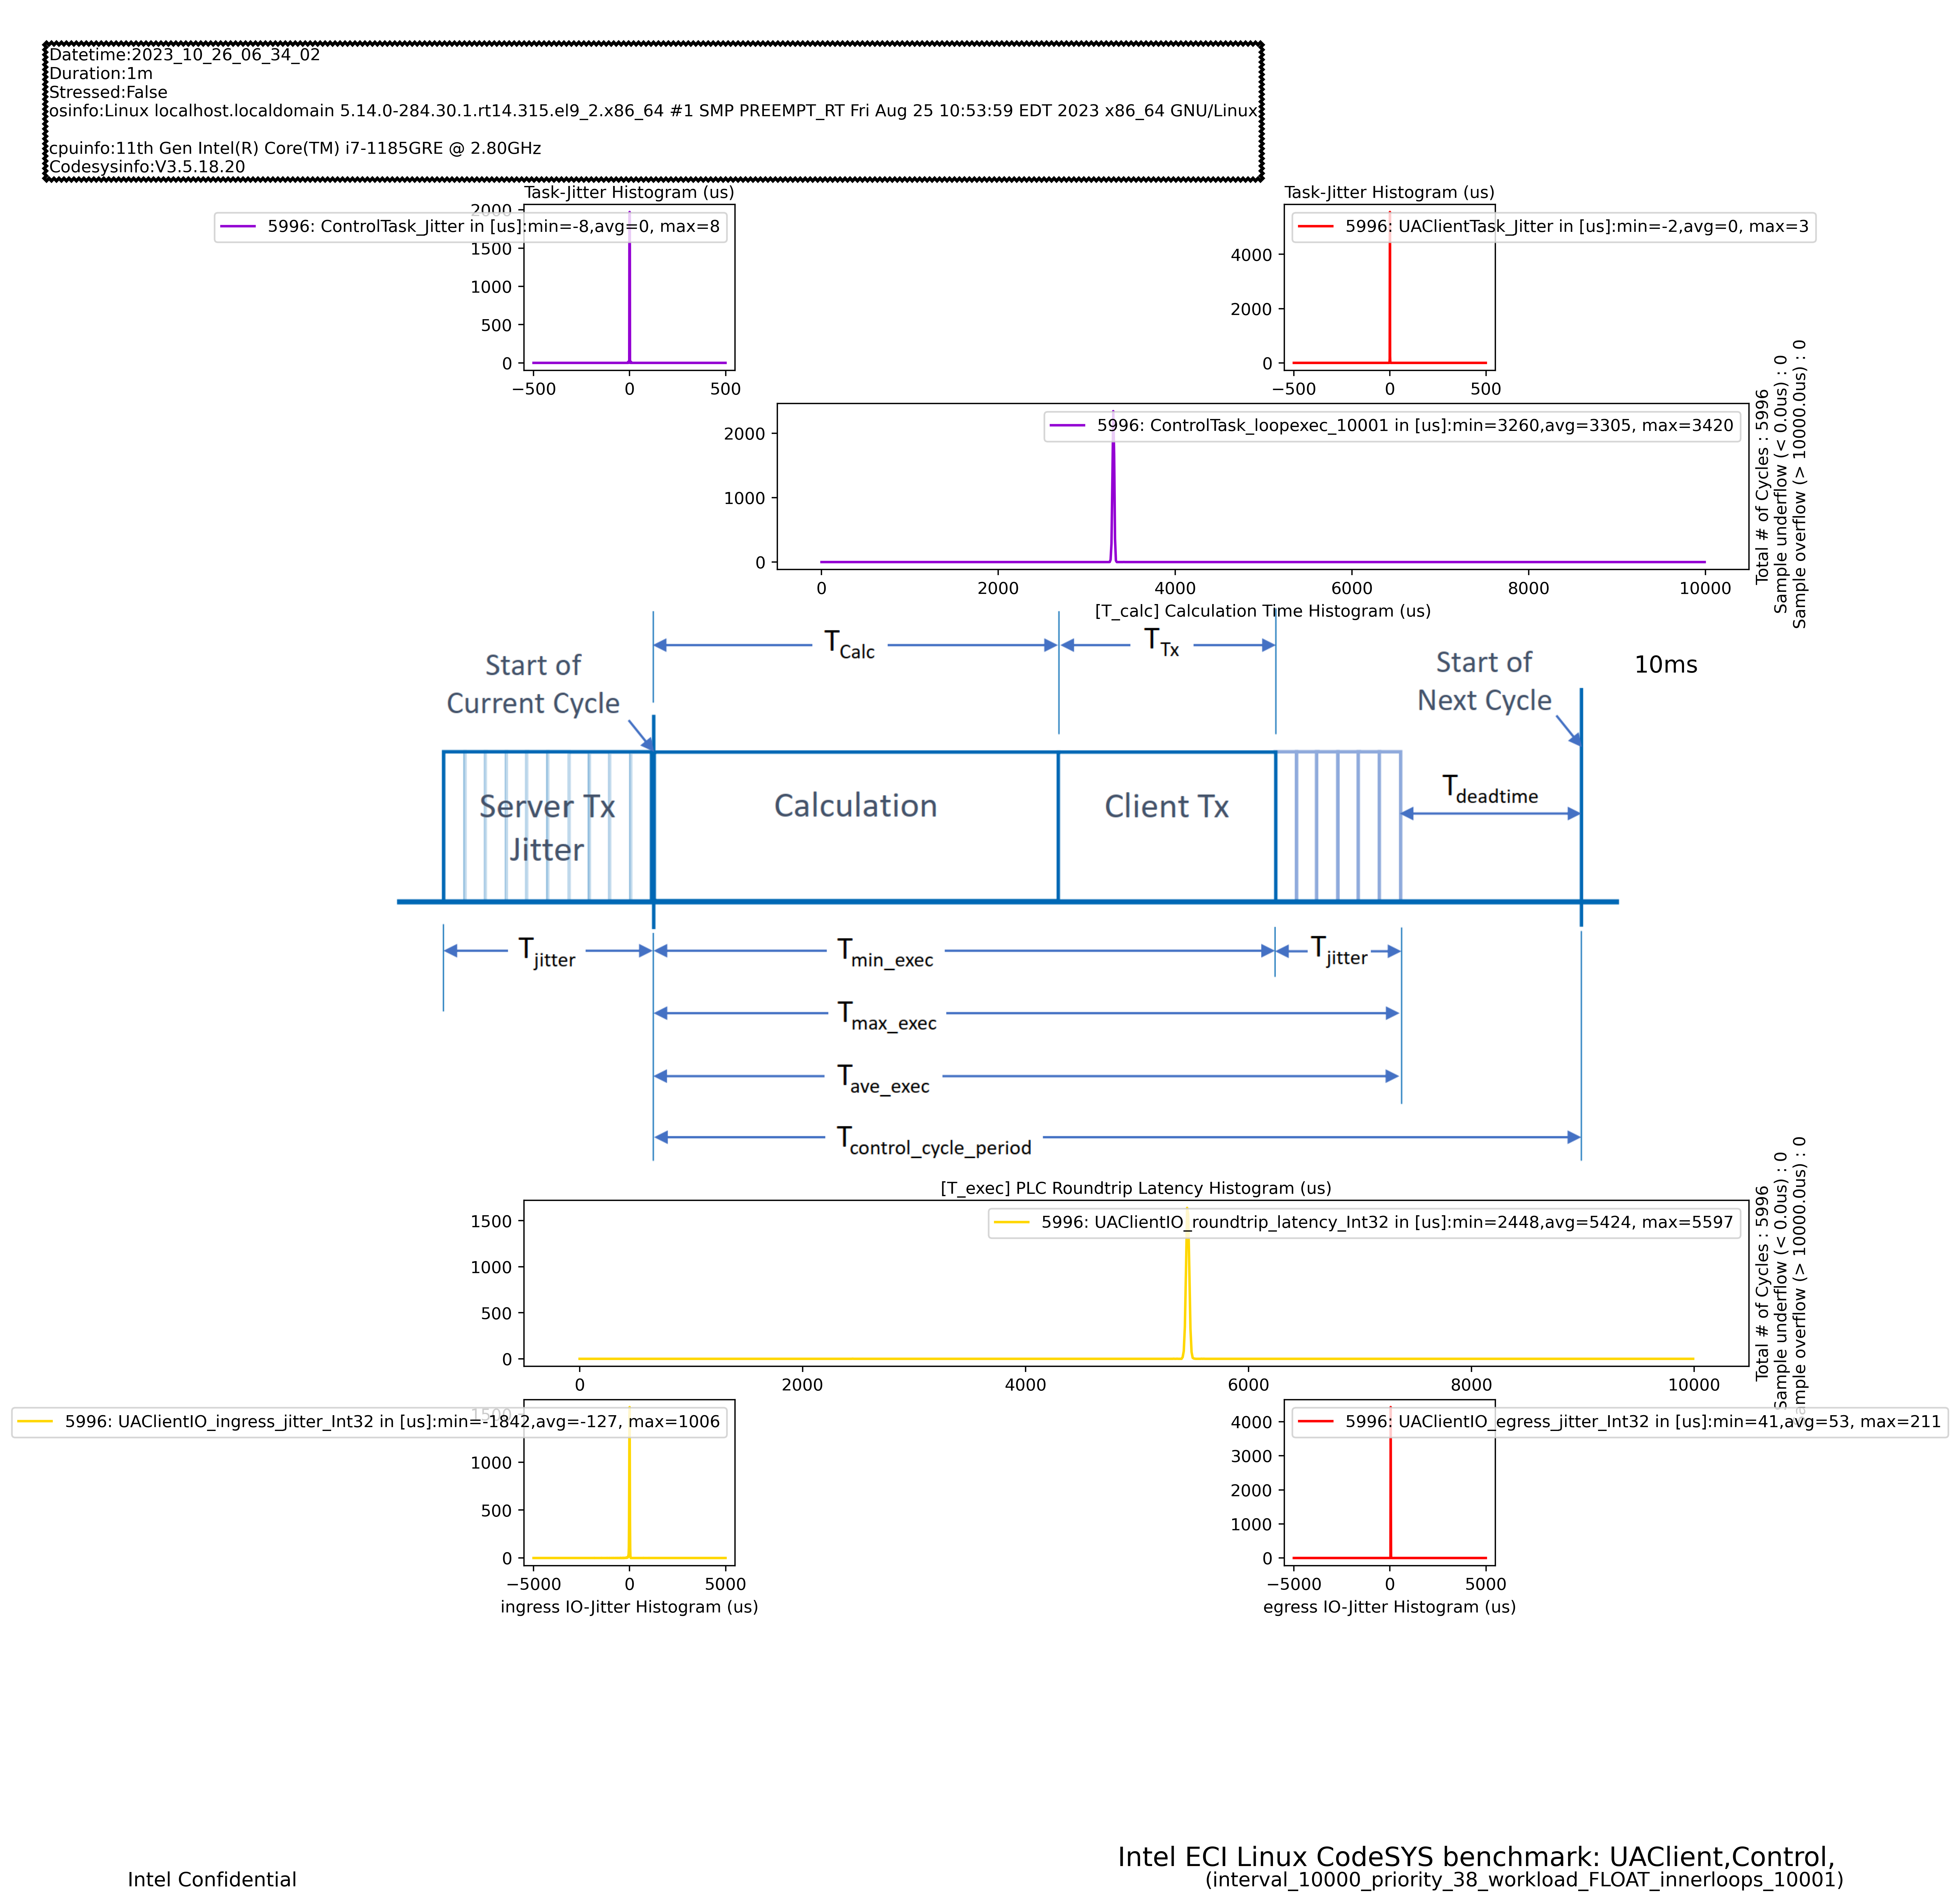
Click the figure below to view the data visualized as histograms:
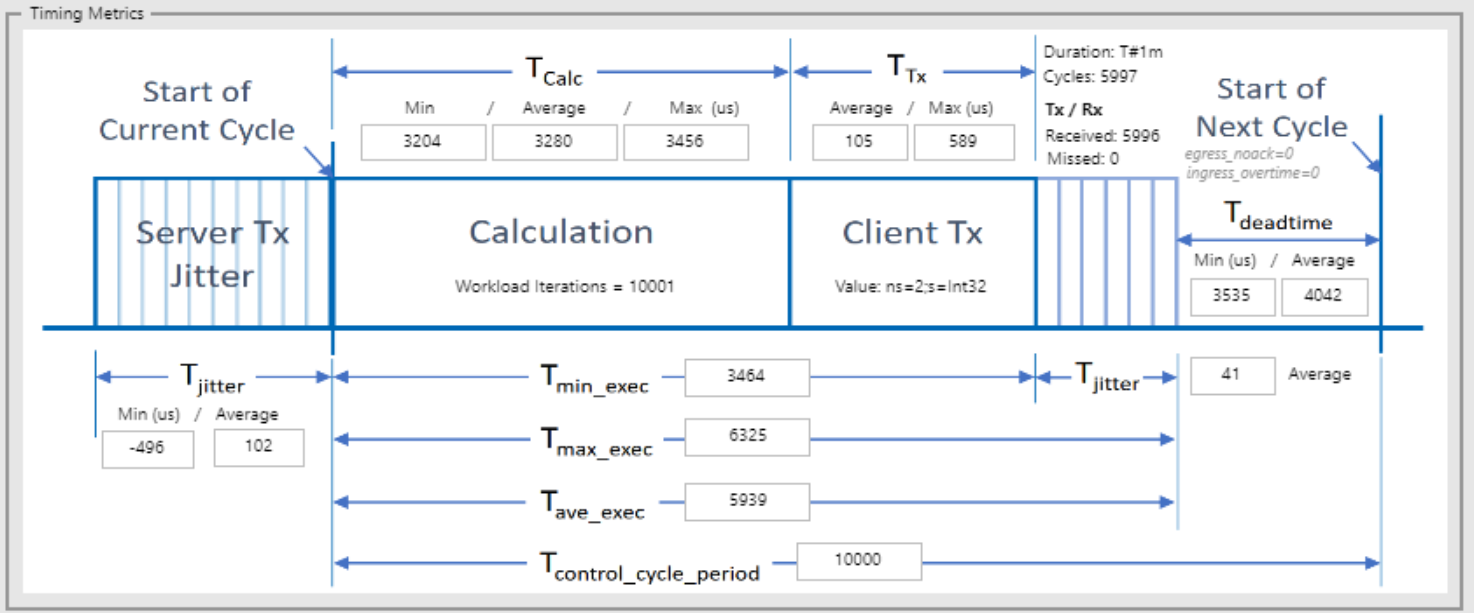
Control Cycle Period (μs) |
10000 |
|---|---|
Transmitted Packets - Total |
5996 |
Transmitted Packets - Missed |
0 |
Calculation Time - Minimum (μs) |
3204 |
Calculation Time - Maximum (μs) |
3456 |
Calculation Time - Average (μs) |
3280 |
Execution Time - Minimum (μs) |
3464 |
Execution Time - Maximum (μs) |
6325 |
Execution Time - Average (μs) |
5939 |
Execution Time Jitter - Average (μs) |
41 |
Client Transmit Time - Average (μs) |
105 |
Client Transmit Time - Maximum (μs) |
589 |
Server Transmit Jitter - Minimum (μs) |
-496 |
Server Transmit Jitter - Average (μs) |
102 |
Dead time - Minimum (μs) |
3535 |
Dead time - Average (μs) |
4042 |
The full data report is available to download here: codesys-opc-ua-client_dual_tgl.zip
Click the figure below to view the data visualized as histograms: