Benchmarks & Performance Characterization
This section discusses the various benchmark tests and configuration to evaluate system performance.
The following section is applicable to:

48-Hour Benchmark
Benchmark |
Units |
Version |
Source |
|---|---|---|---|
48-Hour Benchmark |
(see respective benchmark) |
1.2 |
Intel® created |
The 48-Hour Benchmark exercises the Caterpillar and Cyclictest Workload benchmarks with and without Cache Allocation Technology to demonstrate the benefits of Cache Allocation Technology on real-time workloads.
The ECI 48-Hour Benchmark exercises the following tests and configurations:
- Test 1:
Benchmark: Caterpillar
Benchmark Affinity: Core 3 (13th generation processors and older) or 4 (14th generation processors and newer)
Benchmark Priority:
chrt 99Noisy Neighbor: stress-ng
memcpyNoisy Neighbor Affinity: 0
Duration: ~3 hours
Cache Allocation Technology Enabled: No
- Test 2:
Benchmark: Caterpillar
Benchmark Affinity: Core 3 (13th generation processors and older) or 4 (14th generation processors and newer)
Benchmark Priority:
chrt 99Noisy Neighbor: stress-ng
memcpyNoisy Neighbor Affinity: Core 0
Duration: ~3 hours
Cache Allocation Technology Enabled: Yes (
COS0=0x0f→ Cores 0-2,COS3=0xf0→ Core 3 (13th generation processors and older) or 4 (14th generation processors and newer))
- Test 3:
Benchmark: Cyclictest Workload with interval of 250μs
Benchmark Affinity: Core 3 (13th generation processors and older) or 4 (14th generation processors and newer)
Benchmark Priority:
chrt 99Noisy Neighbor: stress-ng
memcpyNoisy Neighbor Affinity: Core 0
Duration: 24 hours
Cache Allocation Technology Enabled: No
- Test 4:
Benchmark: Cyclictest Workload with interval of 250μs
Benchmark Affinity: Core 3 (13th generation processors and older) or 4 (14th generation processors and newer)
Benchmark Priority:
chrt 99Noisy Neighbor: stress-ng
memcpyNoisy Neighbor Affinity: Core 0
Duration: 24 hours
Cache Allocation Technology Enabled: Yes (
COS0=0x0f→ Cores 0-2,COS1=0xf0→ Core 3 (13th generation processors and older) or 4 (14th generation processors and newer))
Install 48-Hour Benchmark
You can install this component from the ECI repository. Setup the ECI repository, then perform either of the following commands to install this component:
![]()
![]()
- Install from meta-package
$ sudo apt install eci-realtime-benchmarking
- Install from individual Deb package
$ sudo apt install mega-benchmark
![]()
Install from individual RPM package
This package is not yet available for Red Hat® Enterprise Linux®.
Execute 48-Hour Benchmark
To start the benchmark, run the following command:
$ /opt/benchmarking/mega-benchmark/48_hour_benchmark.sh
Results are logged to the files named: results_48_hour_benchmark_<date>, caterpillar_without_cat.log, and caterpillar_with_cat.log.
Interpret 48-Hour Benchmark Results
Since the 48-Hour Benchmark comprises a subset of benchmarks, refer to the respective benchmark sections:
Example of 48-Hour Benchmark Data
Refer to 48-Hour Benchmark Results for the sample data collected from the 48-Hour benchmark.
Mega Benchmark
Benchmark |
Units |
Version |
Source |
|---|---|---|---|
Mega Benchmark |
(see respective benchmark) |
1.2 |
Intel® created |
The ECI mega-benchmark exercises the following tests:
Rhealstone xLatency
Rhealstone stress test
Install Mega Benchmark
You can install this component from the ECI repository. Setup the ECI repository, then perform either of the following commands to install this component:
![]()
![]()
- Install from meta-package
$ sudo apt install eci-realtime-benchmarking
- Install from individual Deb package
$ sudo apt install mega-benchmark
![]()
Install from individual RPM package
This package is not yet available for Red Hat® Enterprise Linux®.
Execute Mega Benchmark
To start the benchmark, run the following command:
$ /opt/benchmarking/mega-benchmark/mega_benchmark.sh
Results are logged to a file named: results_mega_benchmark_<date>
Interpret Mega Benchmark Results
Since the Mega Benchmark comprises a subset of benchmarks, refer to the respective benchmark sections:
Cyclictest Workload
Benchmark |
Units |
Version |
Source |
|---|---|---|---|
Cyclictest |
microseconds |
2.4 Debian 12 (Bookworm) / 2.2 Canonical® Ubuntu® 22.04 (Jammy Jellyfish) |
https://git.kernel.org/pub/scm/utils/rt-tests/rt-tests.git/snapshot/rt-tests-1.5.tar.gz |
Cyclictest is most commonly used for benchmarking real-time (RT) systems. It is one of the most frequently used tools for evaluating the relative performance of an RT. Cyclictest accurately and repeatedly measures the difference between a thread’s intended wake-up time and the time at which it actually wakes up to provide statistics about the system’s latency. It can measure latency in real-time systems caused by the hardware, the firmware, and the operating system.
Install Cyclictest Workload
You can install this component from the ECI repository. Setup the ECI repository, then perform either of the following commands to install this component:
![]()
![]()
- Install from meta-package
$ sudo apt install eci-realtime-benchmarking
- Install from individual Deb package
$ sudo apt install rt-tests-scripts
![]()
Install from individual RPM package
This package is not yet available for Red Hat® Enterprise Linux®.
Execute Cyclictest Workload
An example script that runs the cyclictest benchmark and the README is available at /opt/benchmarking/rt-tests. The script performs the following runtime optimizations before executing the benchmark:
Assigns benchmark thread affinity to core 3 (13th generation processors and older) or 4 (14th generation processors and newer)
Assigns non-benchmark thread affinity to core 0
Changes the priority of benchmark thread to 95 (using:
chrt -f 95)Disables kernel machine check interrupt
Increases the thread runtime utilization to infinity
To start the benchmark, run the following command:
$ sudo /opt/benchmarking/rt-tests/start-cyclic.py
Default parameters are used unless otherwise specified. Run the script with --help to list the modifiable arguments.
See also
Sanity Check 0 - Cyclictest Workload provides an example on how to run this benchmark and display the results.
Interpret Cyclictest Results
Short |
Explanation |
|---|---|
T |
Thread: Thread index and thread ID |
P |
Priority: RT thread priority |
I |
Interval: Intended wake up period for the latency measuring threads |
C |
Count: Number of times the latency was measured that is, iteration count |
Min |
Minimum: Minimum latency that was measured |
Act |
Actual: Latency measured during the latest completed iteration |
Avg |
Average: Average latency that was measured |
Max |
Maximum: Maximum latency that was measured |
On a non-realtime system, the result might be similar to the following:
T: 0 ( 3431) P:99 I:1000 C: 100000 Min:      5 Act:   10 Avg:   14 Max:   39242
T: 1 ( 3432) P:98 I:1500 C:  66934 Min:      4 Act:   10 Avg:   17 Max:   39661
The right-most column contains the most important result, that is, the worst-case latency of 39.242 ms / 39242 us (Max value).
On a realtime-enabled system, the result might be similar to the following:
T: 0 ( 3407) P:99 I:1000 C: 100000 Min:      7 Act:   10 Avg:   10 Max:      18
T: 1 ( 3408) P:98 I:1500 C:  67043 Min:      7 Act:    8 Avg:   10 Max:      22
This result indicates an apparent short-term worst-case latency of 18 us. According to this, it is important to pay attention to the Max values as these are indicators of outliers. Even if the system has decent Avg (average) values, a single outlier as indicated by Max is enough to break or disturb a real-time system.
According to the README from the https://git.kernel.org/pub/scm/utils/rt-tests/rt-tests.git repository:
Running cyclictest only over a short period of time and without creating appropriate real-time stress conditions is rather meaningless, since the execution of an asynchronous event from idle state is normally always quite fast, and every - even non-RT system - can do that. The challenge is to minimize the latency when reacting to an asynchronuous event, irrespective of what code path is executed at the time when the external event arrives. Therefore, specific stress conditions must be present while cyclictest is running to reliably determine the worst-case latency of a given system.
Additional Cyclictest Workload
Another script, rt_bmark.py, performs stress workloads when executing the benchmark cyclictest.
To start the benchmark, run the following command:
$ sudo /opt/benchmarking/rt-tests/rt_bmark.py
Hardware Latency Detector
Benchmark |
Units |
Version |
Source |
|---|---|---|---|
Hardware Latency Detector |
N/A |
0.8 |
https://git.kernel.org/pub/scm/utils/rt-tests/rt-tests.git/snapshot/rt-tests-1.5.tar.gz |
Install Hardware Latency Detector
You can install this component from the ECI repository. Setup the ECI repository, then perform either of the following commands to install this component:
![]()
![]()
- Install from meta-package
$ sudo apt install eci-realtime-benchmarking
- Install from individual Deb package
$ sudo apt install rt-tests-scripts
Execute Hardware Latency Detector
To start the benchmark, run the following command:
$ hwlatdetect --threshold=1us --duration=48h --window=1000ms --width=950ms --report=hwlat.log
Default parameters are used. Run the command with --help to list the modifiable arguments.
Interpret Hardware Latency Detector Results
hwlatdetect:  test duration 172800 seconds
   detector: tracer
   parameters:
        Latency threshold: 1us
        Sample window:     1000000us
        Sample width:      950000us
     Non-sampling period:  50000us
        Output File:       hwlat.log

Starting test
test finished
Max Latency: 8509us
Samples recorded: 12
Samples exceeding threshold: 12
3 SMIs occured on cpu 0
3 SMIs occured on cpu 1
3 SMIs occured on cpu 2
3 SMIs occured on cpu 3
3 SMIs occured on cpu 4
3 SMIs occured on cpu 5
3 SMIs occured on cpu 6
3 SMIs occured on cpu 7
SMIs during run: 24
report saved to hwlat.log (12 samples)
ts: 1716179830.249172536, inner:0, outer:8509
ts: 1716181519.723242206, inner:0, outer:13
ts: 1716194771.846998020, inner:6, outer:3
ts: 1716265958.875256655, inner:12, outer:11
ts: 1716277767.975081358, inner:0, outer:4
ts: 1716286007.859183873, inner:8, outer:0
ts: 1716296995.882698754, inner:9, outer:0
ts: 1716308068.834712777, inner:0, outer:2
ts: 1716313762.634791257, inner:0, outer:6
ts: 1716323403.043182533, inner:0, outer:6
ts: 1716339459.875197056, inner:13, outer:11
ts: 1716340021.026991303, inner:4, outer:1
The benchmark results of hwlatdetect mainly includes the following parts:
SMI counts occurred during benchmark through reading MSR.
Sample recorded during benchmark.
hwlatdetect detects the highest latency value in a sample window within sample width and checks if it exceeds the threshold. If the highest value exceeds the threshold, hwlatdetect records the sample in the log. Every sample record in the log consists of three parameters: ts, inner and outer. These parameters are described below:
ts(Unit: second): The timestamp of the sample recorded based on real-time clock.inner(Unit: microsecond): The latency between two consecutive reads for timestamp.outer(Unit: microsecond): The latency between two consecutive loops for sampling the hardware latency.
Jitter
Benchmark |
Units |
Version |
Source |
|---|---|---|---|
Jitter |
CPU Cycles |
1.9 |
Intel® created |
The Jitter benchmark measures the execution time variation of a CPU test workload. The performance of the workload is impacted by kernel interrupts. Minimizing these interrupts also minimizes the jitter that applications could potentially experience.
Install Jitter
You can install this component from the ECI repository. Setup the ECI repository, then perform either of the following commands to install this component:
![]()
![]()
- Install from meta-package
$ sudo apt install eci-realtime-benchmarking
- Install from individual Deb package
$ sudo apt install jitter pqos-helper
![]()
Install from individual RPM package
This package is not yet available for Red Hat® Enterprise Linux®.
Execute Jitter
An example script that runs the Jitter benchmark is available at /opt/benchmarking/jitter/jitter. The script performs the following runtime optimizations before executing the benchmark:
Assigns benchmark thread affinity to core 3 (13th generation processors and older) or 4 (14th generation processors and newer)
Assigns non-benchmark thread affinity to core 0
Changes the priority of benchmark thread to 95 (using:
chrt -f 95)Disables kernel machine check interrupt
Increases the thread runtime utilization to infinity
Starts a “noisy neighbor” on an adjacent core using
stress-ng --cpu 1 --memcpy
To assess the impact of Cache Allocation Technology, it is useful to perform the benchmark with and without Cache Allocation Technology enabled. The two examples below provide a method of achieving this.
The first step is to establish a baseline performance to compare against. Start the benchmark without Cache Allocation Technology. Take note of the
Inst_Jittervalue, since indicates the execution jitter in CPU cycles experienced by the benchmark.$ sudo /opt/benchmarking/jitter/start-benchmark.py
Now, start the benchmark with Cache Allocation Technology. The pqos-helper tool is being used here to partition the CPU cache and isolate the cache used by the benchmark. Note how only core 3 or 4 is assigned to Class of Service (COS) 1, and the only task executing on core 3 or 4 will be the benchmark. This cache configuration should reduce cache evictions experienced by the benchmark caused by the “noisy neighbor”, resulting in reduced execution jitter.
$ test_core=$(cat /sys/devices/system/cpu/isolated | rev | cut -d '-' -f1 | cut -d ',' -f1 | rev)
$ sudo /opt/pqos/pqos-helper.py --cos0 0x0f --cos1 0xf0 --assign_cos "0=0 0=1 0=2 1=${test_core:-3}" --pqos_rst --pqos_msr --command "/opt/benchmarking/jitter/start-benchmark.py --jitter_args '-c ${test_core:-3}'"
Compare the results of the two runs. Ideally, the run with Cache Allocation Technology enabled should exhibit lower execution jitter.
Default parameters are used unless otherwise specified. Run the script with --help to list the modifiable arguments.
See also
Sanity Check 2 - Jitter Workload provides an example on how to run this benchmark and display the results.
Interpret Jitter Results
Inst_Min   Inst_Max   Inst_jitter last_Exec  Abs_min    Abs_max      tmp       Interval     Sample No
 177205     235598      58393     177219     164702     243978    1227096064 3604948177        200      66777
The most important measurement is Inst_jitter. This measurement describes the execution jitter (in CPU cycles) during the display update interval. It is desired that Inst_jitter be as low as possible. The delta between Abs_max and Abs_min is the overall jitter spread. Ideally, the spread must be as low as possible.
LMbench
Benchmark |
Units |
Version |
Source |
|---|---|---|---|
LMbench |
Nanosecond |
3.0a9 |
LMbench is a suite of simple, portable, ANSI/C microbenchmarks for UNIX/POSIX. In general, it measures two key features: latency and bandwidth. LMbench is intended to provide system developers an insight into basic costs of key operations.
lat_mem_rd measures memory read latency for varying memory sizes and strides. The results are reported in nanoseconds per load and have been verified to be accurate to within a few nanoseconds on an SGI Indy. The entire memory hierarchy is measured, including onboard cache latency and size, external cache latency and size, main memory latency, and TLB miss latency. Only data accesses are measured; the instruction cache is not measured.
The specific cache and memory latency benchmark is available at /usr/bin/lat_mem_rd.
Install LMBench
You can install this component from open-source Debian, Canonical® Ubuntu®, or Red Hat® Enterprise Linux® package repositories. Run the following command to install this component.
![]()
![]()
- Install from individual Deb package
$ sudo apt install lmbench
![]()
- Install from individual RPM package
$ sudo dnf install lmbench
Execute LMBench
To start this benchmark, run the following command:
$ cd ~/;taskset -c $CORE_AFFINITY /usr/bin/lat_mem_rd -P 1 $MEMRD_SIZE $MEMRD_CHUNCKS &> /tmp/result_lat_mem_rd.txt
Default parameters are used unless otherwise specified (MEMRD_SIZE and MEMRD_CHUNCKS variables). Run the script with --help to list the modifiable arguments.
See also
Sanity Check 1 - LMbench Workload provides an example on how to run this benchmark and display the results.
Interpret LMbench Results
The output is best examined graphically. You get a graph with four plateaus. The graph should plotted in log base 2 of the array size on the X axis and the latency on the Y axis. Each stride is then plotted as a curve. The plateaus that appear correspond to the onboard cache (if present), external cache (if present, main memory latency, and TLB miss latency.
Caterpillar
Benchmark |
Units |
Version |
Source |
|---|---|---|---|
Caterpillar |
CPU Cycles |
1.3 |
Intel® created |
The Caterpillar benchmark measures the execution time variation of a memory test workload. The performance of the workload is impacted by cache misses. Using Cache Allocation Technology improves application performance by assigning CPU affinity to cache ways, which can be dedicated to real-time applications.
Install Caterpillar
You can install this component from the ECI repository. Setup the ECI repository, then perform either of the following commands to install this component:
![]()
![]()
- Install from meta-package
$ sudo apt install eci-realtime-benchmarking
- Install from individual Deb package
$ sudo apt install caterpillar pqos-helper
![]()
- Install from meta-package
$ sudo dnf install eci-realtime-benchmarking
- Install from individual RPM package
$ sudo dnf install caterpillar pqos-helper
Execute Caterpillar
An example script running the Caterpillar benchmark is available at /opt/benchmarking/caterpillar/start-benchmark.py. The script performs the following runtime optimizations before executing the benchmark:
Assigns benchmark thread affinity to core 3 (13th generation processors and older) or 4 (14th generation processors and newer)
Assigns non-benchmark thread affinity to core 0
Changes priority of benchmark thread to 95 (using:
chrt -f 95)Disables kernel machine check interrupt
Increases thread runtime utilization to infinity
Starts a “noisy neighbor” on an adjacent core using
stress-ng --cpu 1 --memcpy
To assess the impact of Cache Allocation Technology, it is useful to perform the benchmark with and without Cache Allocation Technology enabled. The two examples below provide a method of achieving this.
The first step is to establish a baseline performance to compare against. Start the benchmark without Cache Allocation Technology by assigning cores 0-3 the same class of service. Take note of the
SmplJittervalue, since indicates the execution jitter in CPU cycles experienced by the benchmark.$ sudo /opt/pqos/pqos-helper.py --cos0 0xff --assign_cos "0=0 0=1 0=2 0=3" --pqos_rst --pqos_msr --command "/opt/benchmarking/caterpillar/start-benchmark.py --caterpillar_args '-c 3'"
Now, start the benchmark with Cache Allocation Technology. The pqos-helper tool is being used here to partition the CPU cache and isolate the cache used by the benchmark. Note how only core 3 or 4 is assigned to Class of Service (COS) 1, and the only task executing on core 3 or 4 will be the benchmark. This cache configuration should reduce cache evictions experienced by the benchmark caused by the “noisy neighbor”, resulting in reduced execution jitter.
$ test_core=$(cat /sys/devices/system/cpu/isolated | rev | cut -d '-' -f1 | cut -d ',' -f1 | rev)
$ sudo /opt/pqos/pqos-helper.py --cos0 0x0f --cos1 0xf0 --assign_cos "0=0 0=1 0=2 1=${test_core:-3}" --pqos_rst --pqos_msr --command "/opt/benchmarking/caterpillar/start-benchmark.py --caterpillar_args '-c ${test_core:-3}'"
Compare the results of the two runs. Ideally, the run with Cache Allocation Technology enabled should exhibit lower execution jitter.
Default parameters are used unless otherwise specified. You may run the script with --help to list the modifiable arguments.
See also
Sanity Check 3 - Caterpillar Workload provides an example on how to run this benchmark and display the results.
Interpret Caterpillar Results
SampleMin  SampleMax   SmplJitter  SessionMin SessionMax SessionJitter  Sample
  254023     300255       9649       233516     303071       9743        200
The most important measurement is SessionJitter. This measurement describes the maximum execution jitter (in CPU cycles) during the entire execution of the benchmark. It is desired that SessionJitter be as low as possible. The delta between SessionMax and SessionMin is the overall execution spread. Ideally, the spread must be as low as possible.
RT-app
Benchmark |
Units |
Version |
Source |
|---|---|---|---|
rt-app |
N/A |
|
RT-app is a tool that can be used to emulate a use case. Not only the sleep and run pattern can be emulated, but also the dependency between tasks like accessing same critical resources, creating sequential wake up, or syncing the wake up of threads. The use case is described in a JSON like file, which is first parsed by workgen and then rt-app.
Install RT-app
You can install this component from the ECI repository. Setup the ECI repository, then perform either of the following commands to install this component:
![]()
![]()
- Install from meta-package
$ sudo apt install eci-realtime-benchmarking
- Install from individual Deb package
$ sudo apt install rt-app-scripts
![]()
Install from individual RPM package
This package is not yet available for Red Hat® Enterprise Linux®.
Execute RT-app
An example script that runs the RT-app tool is available at /opt/benchmarking/rt-app.
Rhealstone
Benchmark |
Units |
Version |
Source |
|---|---|---|---|
Rhealstone |
nanoseconds |
1.2 |
https://gitlab.denx.de/Xenomai/xenomai/tree/master/testsuite/latency |
Rhealstone is a measurement targeted specifically toward true multitasking solutions. In this benchmark, five categories of activities crucial to the performance of real-time systems are represented:
Task switching time
Preemption time
Semaphore shuffling time
Interrupt latency time
Deadlock breaking time
Install Rhealstone
You can install this component from the ECI repository. Setup the ECI repository, then perform either of the following commands to install this component:
![]()
![]()
- Install from meta-package
$ sudo apt install eci-realtime-benchmarking
- Install from individual Deb package
# For non-Xenomai kernels
$ sudo apt install rhealstone

# For Xenomai kernels
$ sudo apt install rhealstone-xenomai
![]()
Install from individual RPM package
This package is not yet available for Red Hat® Enterprise Linux®.
Execute Rhealstone
Two example scripts that run the Rhealstone benchmark are available at /opt/benchmarking/(rhealstone|rhealstone-xenomai). The script run_xlatency.py performs the following runtime optimizations before executing the benchmark latency:
Assigns benchmark thread affinity to core 0
Assigns non-benchmark thread affinity to core 1, as stress workloads.
Dumps histogram to <file> in a format easily readable with
gnuplotPrints statistics of minimum, average, and maximum latencies
Sets sampling period to 250 us
To start the benchmark, run the following script:
//without stress
$ cd /opt/benchmarking/rhealstone
$ sudo ./run_xlatency.py -T <runtime>

//with stress
$ cd /opt/benchmarking/rhealstone
$ sudo ./run_xlatency.py -T <runtime> --stress

//with stress exclude gfx for image without glxgears
$ cd /opt/benchmarking/rhealstone
$ sudo ./run_xlatency.py -T <runtime> --stress --no-gfx
Command line parameters:
runtime: Set test period in seconds.
Default parameters are used unless otherwise specified. Run the script with --help to list the modifiable arguments. Otherwise, run the latency benchmark directly with --help to list the modifiable arguments.
See also
Sanity Check 4 - Latency Workload provides an example on how to run this benchmark and display the results.
The script run_rhealstone_bmark.py executes benchmarks ctx_lat, deadlock_bt, preempt_lat, and semaphore_lat separately for <num> times and gets the average result for each.
To start the benchmark, run the following command:
$ cd /opt/benchmarking/rhealstone
$ sudo ./run_rhealstone_bmark.py <num>
See also
Sanity Check 7 - Rhealstone Workload provides an example on how to run this benchmark and display the results.
Interpret Rhealstone Results
The results obtained from run_xlatency.py are measured interrupt latency. Lower values are better.
...
#Avg: 0.683 us
#Max: 4.656 us
#Max list: [4.656]
...
The results obtained from run_rhealstone_bmark.py are measured time to perform: task switching, preemption, semaphore shuffling, and deadlock breaking. Lower values are better.
// Task Switching
#ctx_sum is 84878.48
#ctx_avg is 848.78

// Deadlock Breaking
#dead_sum is 225127.860003
#dead_avg is 2251.278600

// Preemption
#pree_sum is 114065.000000
#pree_avg is 1140.650000

// Semaphore Shuffling
#sem_sum is 208111.365000
#sem_avg is 2081.113650
MSI Latency
Benchmark |
Units |
Version |
Source |
|---|---|---|---|
MSI Latency |
nanoseconds |
0.5.0-k |
Intel® created |
Message Signaled Interrupt (MSI) Latency measures interrupt latency for MSIs generated by a discrete or integrated peripheral device, such as the Intel® I210 Ethernet Controller Series and serviced by the IA core. This benchmark measures the MSI interrupt triggered back latency of Intel® I210 Ethernet Controller Series kernel module.
Attention
This benchmark only functions in tandem with an Intel® I210 Ethernet Controller.
Install MSI Latency
You can install this component from the ECI repository. Setup the ECI repository, then perform either of the following commands to install this component:
![]()
![]()
- Install from meta-package
$ sudo apt install eci-realtime-benchmarking
- Install from individual Deb package
$ sudo apt install msi-latency
![]()
Install from individual RPM package
This package is not yet available for Red Hat® Enterprise Linux®.
Execute MSI Latency
An example script that runs the MSI latency benchmark is available at /opt/benchmarking/msi-latency. The script performs the following runtime optimizations before executing the benchmark:
Moves all IRQs (except timer and cascade) to core 0
Moves all rcu tasks to either core 0, 4, 5, 6, 7, except 1-3
Changes the real-time attributes of all rcu tasks to
SCHED_OTHERand priority 0Changes the real-time attributes of all tasks on core 1, 2 and 3 to
SCHED_OTHERand priority 0Changes the real-time attributes of all tasks to
SCHED_OTHERand priority 0
Required kernel boot parameters:
isolcpus=1,3 rcu_nocbs=1,3 nohz_full=1,3 igb.blacklist=yes
To start the benchmark, run the following commands:
$ cd /opt/benchmarking/msi-latency
$ sudo ./msiLatencyTest.sh <RUN_CORE> <IRQ_PERIOD(ms)> <IRQ_COUNT>
$ cat /sys/kernel/debug/msi_latency_test/current_value   # Get current result
Default parameters are used when insert msi_lat.ko, unless otherwise specified. Command line parameters:
Parameter
Description
coreSpecIRQCore on which the
msi_latencytest IRQ handler is run. [0 to n]
coreSpecWQCore on which the
msi_latencytest work queue is run. [0 to n]
irqSpecRun IRQ as a pthread [0] or in legacy mode [1].
irqPeriodPeriod between interrupts in milliseconds.
irqCountNumber of IRQs to send. n > 0 will be finite. n < 0 will be infinite.
verbosityVerbosity of periodic prints to
dmesg. [0 to 3]
offsetStartOffset that is subtracted from each starting timestamp when calculating latency and generating histogram buckets (does not effect raw values). Mechanism used to remove delta time (nanosecond) from when SW requests interrupt to HW services interrupt.
blockIRQDuration (clock ticks) for which the interrupts are blocked after requesting MSI.
See also
Sanity Check 5 - MSI Latency provides an example on how to run this benchmark and display the results.
Interpret MSI Latency Results
************ RESULTS (ns) ************

[15996.755567] * Max: 9056
[15996.755570] * Avg: 6626
[15996.755573] * Min: 5360
The reported value is the measured time to service MSI requests to the Intel® I210 Ethernet Controller. Lower values are better.
MSI Jitter
Benchmark |
Units |
Version |
Source |
|---|---|---|---|
MSI Jitter |
nanoseconds |
0.1.0-m |
Intel® created |
MSI jitter benchmark tool is a benchmark tool to check the jitter of cyclical MSI from an Intel® I210 Ethernet Controller. This tool records each cyclical MSI timestamps in the software interrupt handler and calculates the delta between each timestamps and compares the delta with cycle time as the jitter.
Attention
This benchmark only functions in tandem with an Intel® I210 Ethernet Controller.
Install MSI Jitter
You can install this component from the ECI repository. Setup the ECI repository, then perform either of the following commands to install this component:
![]()
![]()
- Install from meta-package
$ sudo apt install eci-realtime-benchmarking
- Install from individual Deb package
$ sudo apt install msi-jitter
![]()
Install from individual RPM package
This package is not yet available for Red Hat® Enterprise Linux®.
Execute MSI Jitter
An example script that runs the MSI latency benchmark is available at /opt/benchmarking/msi-jitter. The script performs the following runtime optimizations before executing the benchmark:
Moves all IRQs (except timer and cascade) to core 0
Moves all rcu tasks to either core 0, 4, 5, 6, 7, except 1-3
$ sudo /opt/benchmarking/msi-jitter/irq_rcu.sh
To start the benchmark, run the following commands:
$ cd /opt/benchmarking/msi-jitter
$ sudo ./run_msijitter.sh <unbind_igb_id> <run_core> <interval(ms)> <runtime(s)>
$ cat /sys/kernel/debug/msi_jitter_test/current_value   # Get current result
Command line parameters:
unbind_igb_id:  PCI ID of NIC to unbind.
                Can find PCI ID with: `lspci -v | grep -Ei 'Ethernet controller: Intel Corporation.*I210'`.
run_core:       Set which core will handle MSI interrupt.
interval:       Set cycle time.
runtime:        Set test period.
See also
Sanity Check 6 - MSI Jitter provides an example on how to run this benchmark and display the results.
Interpret MSI Jitter Results
 ************ RESULTS (ns) ************

[ 4177.021407] * Max: 3184
[ 4177.023363] * Avg: 222
[ 4177.025218] * Min: 0
The reported value is the measured jitter of servicing MSI requests to the Intel® I210 Ethernet Controller. Lower values are better.
MMIO Latency
Benchmark |
Units |
Version |
Source |
|---|---|---|---|
MMIO Latency |
nanoseconds |
1.1 |
Intel® created |
MMIO-latency is a simple driver that creates an affinitized thread to read a virtual map physical address (Memory-mapped I/O). Memory read latency is measured. The thread is created and started on initialization and loops LOOPS number of times. It also provides a char device that reads the current statistic counters, by using inline assembly and kernel function to get a very close benchmark.
Install MMIO Latency
You can install this component from the ECI repository. Setup the ECI repository, then perform either of the following commands to install this component:
![]()
![]()
- Install from meta-package
$ sudo apt install eci-realtime-benchmarking
- Install from individual Deb package
$ sudo apt install mmio-latency
![]()
Install from individual RPM package
This package is not yet available for Red Hat® Enterprise Linux®.
Execute MMIO Latency
An example script that runs the MSI latency benchmark is available at /opt/benchmarking/mmio-latency. The script performs the following runtime optimizations before executing the benchmark:
Moves all IRQs (except timer and cascade) to core 0
Moves all rcu task to either core 0, 4, 5, 6, 7, except 1-3
Changes realtime attributes of all rcu tasks to
SCHED_OTHERand priority 0Changes realtime attributes of all tasks on core 1, 2 and 3 to
SCHED_OTHERand priority 0Changes realtime attributes of all tasks to
SCHED_OTHERand priority 0
To start the benchmark, run the following command:
$ sudo /opt/benchmarking/mmio-latency/mmioLatency.sh <MMIO_address> <block_irq(1 or 0)>
Default parameters are used unless otherwise specified.
Find the physical mmio address to test using the command: lspci -vvv -s $BDF.
For example:
$ lspci -nn ==> 00:02.0 SATA controller
$ lspci -vvv -s 00:02.0 ==> Region 0: Memory at 80002000
See also
Sanity Check 8 - MMIO Latency Workload provides an example on how to run this benchmark and displays the results.
Interpret MMIO Latency Results
RT Core Module
------------------------
 Stats:
  max= 6472
  avg= 2814
  min= 588
  total= 973791140
  loops= 346010

 mmio-outliers: 247
 sched-outliers: 9
The reported value is the latency in reading memory-mapped I/O. Lower values are better.
Real-Time Performance Measurement (RTPM)
Benchmark |
Units |
Version |
Source |
|---|---|---|---|
RTPM |
(See respective benchmark) |
1.11 |
Intel® created |
About RTPM
Real-time computing is critical to industrial usage scenarios. Intel® real-time solutions focus on hard real-time use cases where there could be capability failures if the solutions are not executed within the allotted time span. Examples of the usage scenarios include robotics, automotive, and so on.
In a real-time computing system, several factors could impact the latency of reaction to the trigger event. These factors include hardware design, BIOS configuration, OS kernel configuration, system settings, and so on. RTPM is designed to check the key settings of the system and help you to identify the hot-spot of the system for real-time performance and provide a recommendation based on the Best-known Configuration (BKC). In addition, RTPM provides a way to measure the system scheduling latency with some open source tools.
Install Real-Time Performance Measurement
You can install this component from the ECI repository. Setup the ECI repository, then perform either of the following commands to install this component:
![]()
![]()
- Install from meta-package
$ sudo apt install eci-realtime-benchmarking
- Install from individual Deb package
# For non-Xenomai kernels
$ sudo apt install rtpm

# For Xenomai kernels
$ sudo apt install rtpm-xenomai
![]()
Install from individual RPM package
This package is not yet available for Red Hat® Enterprise Linux®.
RTPM Test Modules
Real-Time Readiness Check
This module leverages one of the Intel® Time Coordinated Computing (Intel® TCC) Tools to check the many attributes that might affect real-time performance.
This module:
Verifies whether the system has a supported processor, BIOS, and OS
Checks for features, such as Intel® Turbo Boost Technology, Enhanced Intel® SpeedStep® Technology, and processor power-saving states, that might affect real-time performance
Reports CPU and GPU frequencies
Operates at the OS level
Boot Command Line Check
This module checks the real-time OS boot command line parameters and recommends settings as per BKCs.
Interpreting Boot Command Line Check Results
=============================BOOT CMDLINE CHECK Mon Dec  1 00:00:00 UTC 2021=============================
----------------------------------------------------------------------------------------------------------------------------------------------------------
|CMDLINE ENTRY                                     |CURRENT VALUE                                     |BKC                                               |
----------------------------------------------------------------------------------------------------------------------------------------------------------
|processor.max_cstate                              |0                                                 |0                                                 |
|intel_idle.max_cstate                             |0                                                 |0                                                 |
|clocksource                                       |tsc                                               |tsc                                               |
|tsc                                               |reliable                                          |reliable                                          |
|nmi_watchdog                                      |0                                                 |0                                                 |
|nosoftlockup                                      |nosoftlockup                                      |nosoftlockup                                      |
|intel_pstate                                      |disable                                           |disable                                           |
|efi                                               |runtime                                           |runtime                                           |
|nohalt                                            |Missing                                           |nohalt                                            |
|nohz                                              |Missing                                           |nohz                                              |
|irqaffinity                                       |0                                                 |0                                                 |
|hugepages                                         |Missing                                           |1024                                              |
|cpufreq.off                                       |Missing                                           |1                                                 |
|i915.enable_rc6                                   |Missing                                           |0                                                 |
|i915.enable_dc                                    |Missing                                           |0                                                 |
|i915.disable_power_well                           |Missing                                           |0                                                 |
|mce                                               |Missing                                           |off                                               |
|hpet                                              |Missing                                           |disable                                           |
|numa_balancing                                    |Missing                                           |disable                                           |
|nohz_full                                         |1,3                                               |[xxxx]                                            |
|isolcpus                                          |1,3                                               |[xxxx]                                            |
|rcu_nocbs                                         |1,3                                               |[xxxx]                                            |
----------------------------------------------------------------------------------------------------------------------------------------------------------
Boot cmdline check finished.
Kernel Configuration Check
This module checks the real-time OS kernel configuration and recommends settings as per the best-known configurations.
Interpret Kernel Configuration Check Results
=============================KERNEL CONFIGURATION CHECK Mon Dec  1 00:00:01 UTC 2021=============================
Kernel config file: /boot/config-5.4.115-rt57-intel-pk-standard+
----------------------------------------------------------------------------------------------------------------------------------------------------------
|KERNEL CONFIG ENTRY                               |CURRENT VALUE                                     |BKC                                               |
----------------------------------------------------------------------------------------------------------------------------------------------------------
|CONFIG_SMP                                        |CONFIG_SMP=y                                      |CONFIG_SMP=y                                      |
|CONFIG_PREEMPT_RCU                                |CONFIG_PREEMPT_RCU=y                              |CONFIG_PREEMPT_RCU=y                              |
|CONFIG_GENERIC_IRQ_MIGRATION                      |CONFIG_GENERIC_IRQ_MIGRATION=y                    |CONFIG_GENERIC_IRQ_MIGRATION=y                    |
|CONFIG_EXPERT                                     |CONFIG_EXPERT=y                                   |CONFIG_EXPERT=y                                   |
|CONFIG_PCIE_PTM                                   |CONFIG_PCIE_PTM=y                                 |CONFIG_PCIE_PTM=y                                 |
|CONFIG_EFI                                        |CONFIG_EFI=y                                      |CONFIG_EFI=y                                      |
|CONFIG_HIGH_RES_TIMERS                            |CONFIG_HIGH_RES_TIMERS=y                          |CONFIG_HIGH_RES_TIMERS=y                          |
|CONFIG_RCU_NOCB_CPU                               |CONFIG_RCU_NOCB_CPU=y                             |CONFIG_RCU_NOCB_CPU=y                             |
|CONFIG_HUGETLBFS                                  |CONFIG_HUGETLBFS=y                                |CONFIG_HUGETLBFS=y                                |
|CONFIG_SCHED_MC_PRIO                              |Missing                                           |CONFIG_SCHED_MC_PRIO=n                            |
|CONFIG_PREEMPT_RT                                 |# CONFIG_PREEMPT_RT is not set                    |CONFIG_PREEMPT_RT=y                               |
|CONFIG_CPU_FREQ                                   |# CONFIG_CPU_FREQ is not set                      |CONFIG_CPU_FREQ=n                                 |
|CONFIG_CPU_ISOLATION                              |CONFIG_CPU_ISOLATION=y                            |CONFIG_CPU_ISOLATION=y                            |
|CONFIG_MIGRATION                                  |CONFIG_MIGRATION=y                                |CONFIG_MIGRATION=y                                |
|CONFIG_PCIEPORTBUS                                |CONFIG_PCIEPORTBUS=y                              |CONFIG_PCIEPORTBUS=y                              |
----------------------------------------------------------------------------------------------------------------------------------------------------------
Kernel configuration check finished.
Real-Time Performance Test
This module contains the following benchmarks to evaluate the performance of the target system:
Xenomai Latency Test
Interpret Real-Time Performance Test Results
Click to toggle gnuplot script
=============================Real-Time PERFORMANCE TEST Mon Dec  1 00:00:02 UTC 2021=============================
Real-time task CPU affinity is set to core 1 by default. Stress is added to other CPU cores if enabled. It's recommended to isolate the core 1 for real-time task from others.
To change the default test duration. Please modify test_cfg file.
Calculating Stress workload running duration...
Setup stress on core 0
Setup stress-ng on core 2
Setup hackbench on core 3
>>> Processing latency...Test duration: 21600s
>>> Latency Test Command: taskset -c 1 /opt/benchmarking/rhealstone/latency -c 1 -p 250 -T 21600 -s -g /tmp/rtpm/latency_test_1643673592.log
# 06:00:00 (periodic user-mode task, 250 us period, priority 99)
# ----lat min|----lat avg|----lat max|-overrun|---msw|
#       7.924|      9.728|     60.457|       0|     0|
7 1
7.5 72
8.5 10063785
9.5 49405401
10.5 22821895
11.5 1447656
...
>>> Processing cyclictest...Test duration: 21600s
>>> Current cyclictest version: cyclictest V 1.00
>>> Cyclictest Test Command: taskset -c 1 cyclictest -p 99 -i 250 -m -a 1 -N -o 3970 -v -r -q -n -D 21600
Max CPUs = 4
# /dev/cpu_dma_latency set to 0us
Thread 0 Interval: 750
Thread 0 using cpu 1.
      0:       0:   16319
      0:    4449:   16103
      0:   10551:    9183
      0:   13394:   15544
      ...
T: 0 (1181838) P:99 I:250 C:85141567 Min:   2910 Act:    3675 Avg:    3627 Max:   20109
>>> Processing msi_latency test...Test duration: 60s
Msi-latency test finish, max:3936 ns, avg:2682 ns, min:2464 ns
>>> Processing msi_jitter test...Test duration: 60s
Msi-jitter test finish, max:1552 ns, avg:304 ns, min:0 ns
>>> Processing rhealstone...Test cycles: 2
>>> Rhealstone Test Command: Cycle 'taskset -c 1 /opt/benchmarking/rhealstone/ctx_lat' 2 times and calcuate the average value
>>> Rhealstone Test Command: Cycle 'taskset -c 1 /opt/benchmarking/rhealstone/deadlock_bt' 2 times and calcuate the average value
>>> Rhealstone Test Command: Cycle 'taskset -c 1 /opt/benchmarking/rhealstone/preempt_lat' 2 times and calcuate the average value
>>> Rhealstone Test Command: Cycle 'taskset -c 1 /opt/benchmarking/rhealstone/semaphore_lat' 2 times and calcuate the average value
[1777.43, 1753.55]
[1777.43, 1753.55]
ctx_sum is 3530.98
ctx_avg is 1765.49


[6895.52, 6299.76]
[6895.52, 6299.76]
dead_sum is 13195.280000
dead_avg is 6597.640000


[3626.61, 5100.095]
[3626.61, 5100.095]
sem_sum is 8726.705000
sem_avg is 4363.352500


[6762.415, 6823.44]
[6762.415, 6823.44]
pree_sum is 13585.855000
pree_avg is 6792.927500
>>> Processing mmio_latency test...Test memory region: 7fe00000 on Device: 01:00.0, Test duration: 300s
MMIO-Latency test finish, max:14698 ns, avg:4871 ns, min:4186 ns
>>> Processing Caterpillar test...
>>> Caterpillar Command: /opt/benchmarking/caterpillar/caterpillar -c 1 -n 10000 -i 50000 -s 200

Cache Allocation Technology (CAT)erpillar benchmark v1.1

The benchmark will execute an operation function 50000 times.
Samples are taken every 10000 test cycles.
A total of 200 samples will be measured.
Thread affinity will be set to core_id: 1

Timings are in CPU Core cycles

SampleMin:       Minimum execution time during the display update interval
SampleMax:       Maximum execution time during the display update interval
SmplJitter:      Jitter in the execution time during the display update interval
SessionMin:      Minimum execution time since the program started or statistics were reset
SessionMax:      Maximum execution time since the program started or statistics were reset
SessionJitter:   Jitter in the execution since the program started or statistics were reset
Sample:          Sample number

Priming cache...

  SampleMin  SampleMax   SmplJitter  SessionMin SessionMax SessionJitter  Sample
    152506     156402        557       152506     156402        557          0
    152429     156426        551       152429     156426        554          1
    152180     156335        561       152180     156426        556          2
    152486     156420        553       152180     156426        556          3
    152278     156600        554       152180     156600        555          4
    152750     156294        547       152180     156600        554          5
    152580     156199        588       152180     156600        559          6
    ...
>>> Caterpillar test finish, Max session jitter: 584 CPU Cycles
>>> Processing Jitter test...
>>> Jitter Command: /opt/benchmarking/jitter/jitter -c 1 -r 20000 -l 80000 -i 200
Linux Jitter testing program version 1.9
Iterations=200
The pragram will execute a dummy function 80000 times
Display is updated every 20000 displayUpdate intervals
Thread affinity will be set to core_id:1
Timings are in CPU Core cycles
Inst_Min:    Minimum Excution time during the display update interval(default is ~1 second)
Inst_Max:    Maximum Excution time during the display update interval(default is ~1 second)
Inst_jitter: Jitter in the Excution time during rhe display update interval. This is the value of interest
last_Exec:   The Excution time of last iteration just before the display update
Abs_Min:     Absolute Minimum Excution time since the program started or statistics were reset
Abs_Max:     Absolute Maximum Excution time since the program started or statistics were reset
tmp:         Cumulative value calcualted by the dummy function
Interval:    Time interval between the display updates in Core Cycles
Sample No:   Sample number

  Inst_Min   Inst_Max   Inst_jitter last_Exec  Abs_min    Abs_max      tmp       Interval     Sample No
    158807     158939        132     158809     158807     158939    3158835200 3179339706          1        132
    158807     158944        137     158852     158807     158944    2370306048 3179421895          2        137
    158807     158938        131     158860     158807     158944    1581776896 3179361092          3        137
    158807     158940        133     158840     158807     158944     793247744 3179379386          4        137
    158807     158944        137     158843     158807     158944       4718592 3179371249          5        137
    ...
>>> Jitter test finish, Max inst jitter: 12772 CPU Cycles
>>> Processing LMbench test...
>>> LMbench Command: taskset -c 1 /usr/bin/lat_mem_rd -P 1 128 512
"stride=512
0.00049 1.590
0.00098 1.590
0.00195 1.590
0.00293 1.590
0.00391 1.590
0.00586 1.590
0.00781 1.590
...
>>> LMbench test finish, 1M memory read latency: 13.655 ns
Real-time performance test finished.
To start the benchmark, run the following commands:
$ sudo /opt/benchmarking/rtpm/rtpm_exec -p "./output" -n "report.csv" -a
The results are logged in: ./output/rtpm_test.log
RTPM Command Line Parameters
Parameter |
Explanation |
|---|---|
|
Specify the path of the test file |
|
Specify the test report name in CSV format (must end with .csv) |
|
Execute Latency or Cyclictest test when running performance test |
|
Execute Rhealstone test when running performance test |
|
Execute MSI-latency test when running performance test |
|
Execute MSI-jitter test when running performance test |
|
Execute MMIO-Latency test when running performance test |
|
Execute Caterpillar test when running performance test. |
|
Execute Jitter test when running performance test. |
|
Execute LMbench test when running performance test. |
|
Enable stress when running performance test |
|
Execute all performance tests except Latency & Cyclictest, the program will help to identify current Real-Time framework, if it is Xenomai, will run Latency otherwise if it is Preempt-RT, it will run Cyclictest. If not specified, settings in configuration file will be used. |
|
Show the help list |
For more information on using Intel® ECI with RTPM, refer to the guide.
Real-Time Compute Performance (RTCP) Benchmarks
Benchmark |
Units |
Version |
Source |
Description |
|---|---|---|---|---|
Nanoseconds |
Follows version of dpdk |
Intel® created |
The Real-Time Compute Performance (RTCP) benchmark measures the latency of round-trip network packets generated and processed by a simulated control cycle Applications. It utilizes Data Plane Development Kit (DPDK) to accelerate network packet processing. |
Ethernet TSN Intel Reference Benchmarks
Benchmark |
Units |
Version |
Source |
Description |
|---|---|---|---|---|
microseconds |
0.9.13 |
Tool to check Ethernet endpoints ingress and egress Traffic-class QoS under IEEE 802.1Q-2018 Enhancements for Scheduled Traffic (EST) polices with various Intel® Ethernet Controller TSN hw-offloading capabilities |
||
microseconds |
4.0 |
The Linutronix TSN Testbench is a real-time and non-real time traffic validation tool for converged TSN networks. PROFINET as well as OPC/UA PubSub and other configurable protocols are supported. |
Install Linutronix TSN Testbench
You can install this component from the ECI repository. Setup the ECI repository, then perform either of the following commands to install this component:
![]()
![]()
- Install from individual Deb package
$ sudo apt install tsn-testbench
![]()
Install from individual RPM package
$ sudo dnf install tsn-testbench
For all details about usage please refer to https://linutronix.github.io/TSN-Testbench/usage.html
CODESYS Benchmarking Applications
Benchmark |
Units |
Version |
Source |
Description |
|---|---|---|---|---|
microseconds |
4.5.0.0-6 |
Intel® created |
The CODESYS Benchmark is an example CODESYS Web-UI, OPC UA and SoftPLC logic application that allows remote-user access to cyclic control of compute and IO tasks. |
|
microseconds |
4.5.0.0-6 |
Intel® created |
The CODESYS OPC UA Client Benchmark utilizes the CODESYS SoftPLC to instantiate an OPC UA Client. Many parameters of the application are modifiable such as workload type, workload iterations, noise generation, OPC UA publish interval, and OPC UA monitored item selection. Cyclic task execution times are measured from which minimum, maximum, and jitter measurements are derived. These measurements allow performance characterization of the CODESYS SoftPLC OPC UA Client implementation. |
|
microseconds |
4.5.0.0-6 |
Intel® created |
The CODESYS ST-Fragment is an example application that allows configurable and observable CODESYS SoftPLC logic regression testing. |
6-axis EtherCAT Benchmark
Benchmark |
Units |
Version |
Source |
|---|---|---|---|
6-axis EtherCAT benchmark |
microseconds |
0.3.0 |
Intel® created |
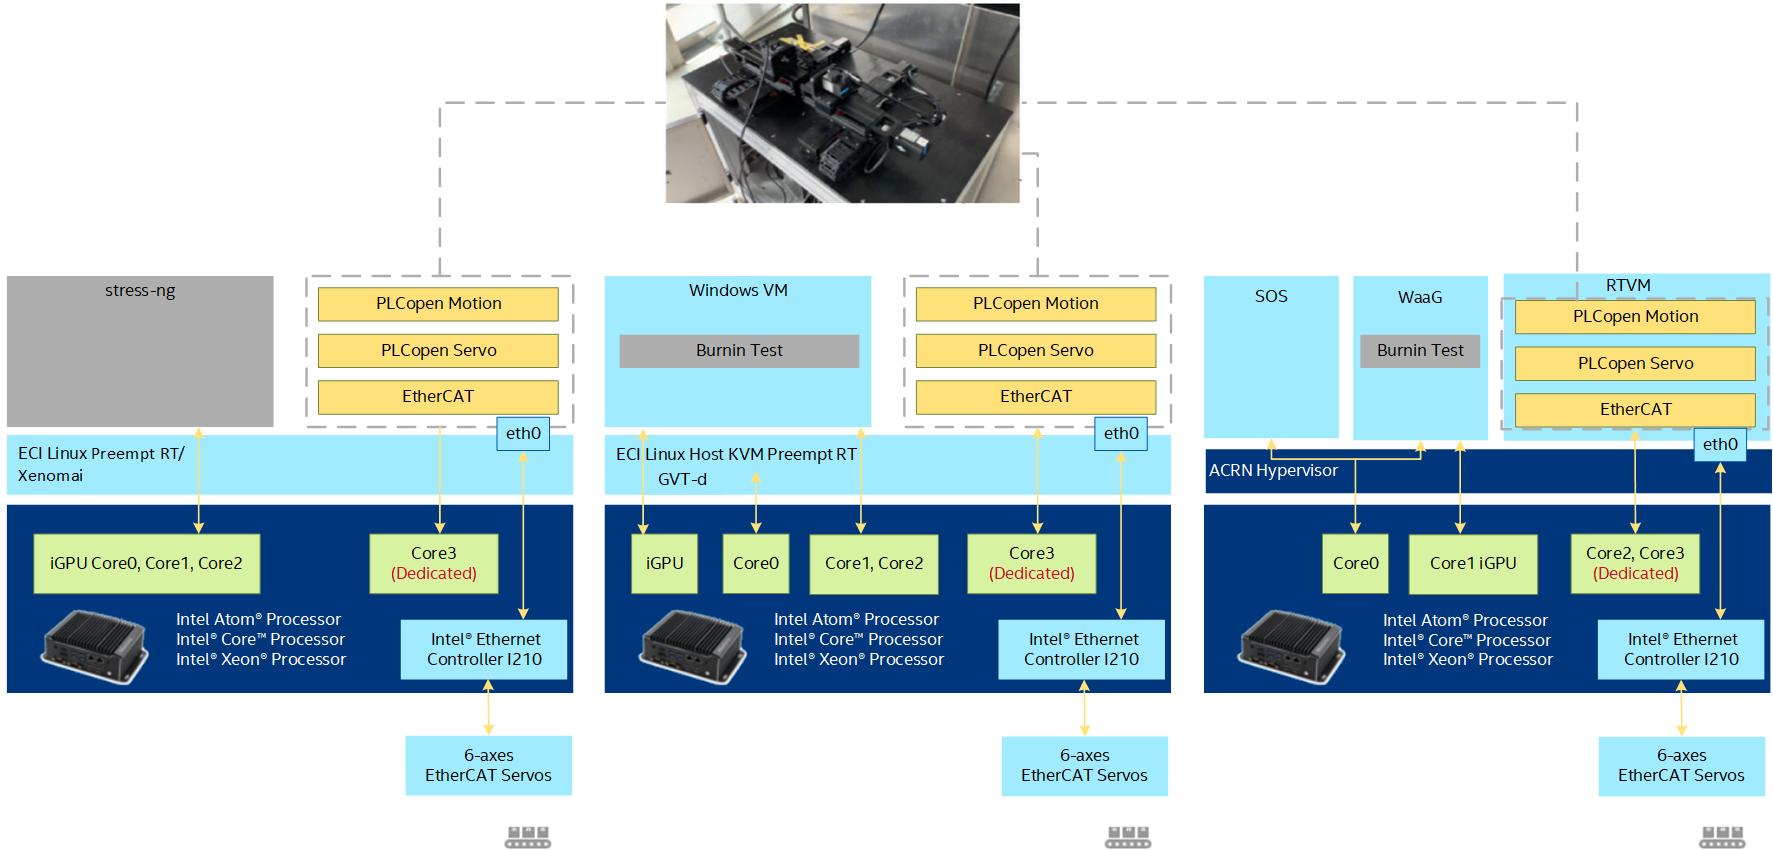
About 6-axis EtherCAT Benchmark
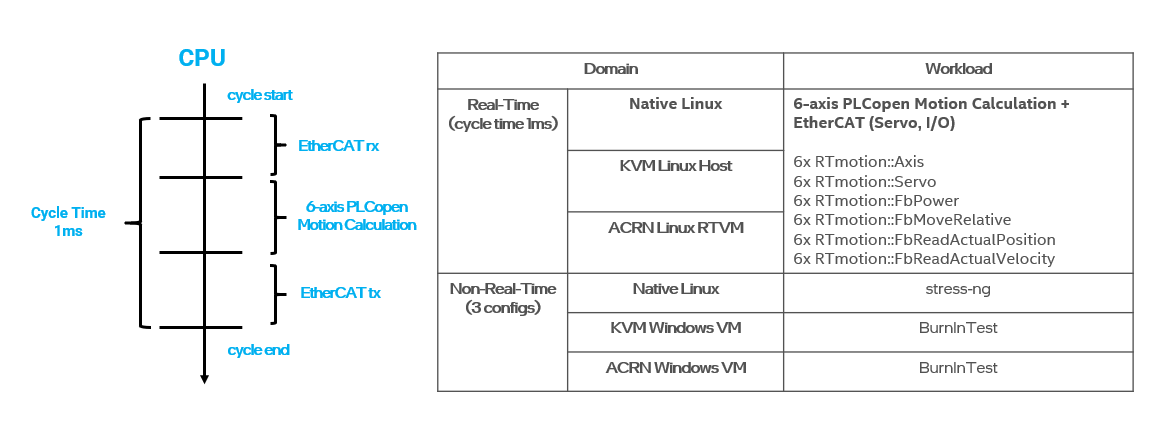
The benchmark uses the IgH EtherCAT Master Stack and PLCopen Motion Control library (RTmotion) to drive a real-world 6-axis EtherCAT test bench (6 EtherCAT Servos, 8 EtherCAT IO) and measures the jitter and motion execution time of the control workload in each real-time cycle (1ms). The goal of this benchmark is to evaluate ECI real-time performance when driving EtherCAT devices with different non-real-time workloads.
Using different non-real-time noises, the benchmark is implemented and tested in three configurations to simulate real-world usage scenarios:
Install 6-axis EtherCAT Benchmark
You can install this component from the ECI repository. Setup the ECI repository, then perform either of the following commands to install this component:
![]()
![]()
- Install from meta-package
$ sudo apt install eci-softplc-plcopen
- Install from individual Deb package
# For non-Xenomai kernels
$ sudo apt install plcopen-servo

# For Xenomai kernels
$ sudo apt install plcopen-servo-xenomai
![]()
Install from individual RPM package
This package is not yet available for Red Hat® Enterprise Linux®.
Execute 6-axis EtherCAT Benchmark
To start the benchmark, run the following command:
# For running in 1ms cycle time
$ sudo /opt/plcopen/six_rtmotion_demo -n /opt/plcopen/inovance_six_1ms.xml -i 1000

# For running in 250us cycle time
$ sudo /opt/plcopen/six_rtmotion_demo -n /opt/plcopen/inovance_six_250us.xml -i 250
Interpret 6-axis EtherCAT Benchmark Results
Using /opt/plcopen/EtherCAT_6xInov_ENI.xml
MOTION_ENTRY: Requesting master index 0:...
MOTION_ENTRY: Creating domain...
MOTION_ENTRY: Register servo driver...
Activating master...
Axis #0 powered on, axis_pos_ = -36.065203
Axis #1 powered on, axis_pos_ = 50.606118
Axis #2 powered on, axis_pos_ = 129.662308
Axis #3 powered on, axis_pos_ = 141.972963
Axis #4 powered on, axis_pos_ = -61.609828
Axis #5 powered on, axis_pos_ = -61.655695
^C******************************************************
jitter time          2.220...     2.689...     9.867
motion time          0.000...     7.347...    51.513
******************************************************
End of Program
Press crtl+c to stop the real-time PLC program. The jitter time shows the [minimum, average, maximum] values of real-time cycle jitter. The motion time shows the [minimum, average, maximum] execution time of 6-axis PLCopen motion calculation.
Robotic 6-axis Motion Control Benchmark
Benchmark |
Units |
Version |
Source |
|---|---|---|---|
Robotic 6-axis Motion Control Benchmark |
microseconds |
0.1.0 |
Intel® created |
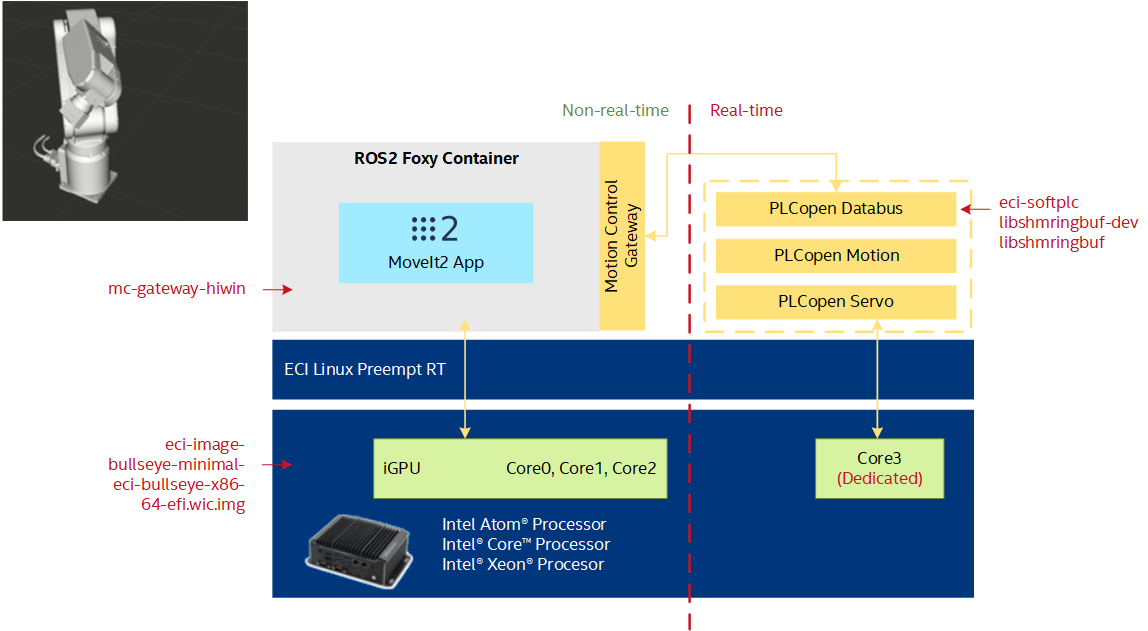
About Robotic 6-axis Motion Control Benchmark
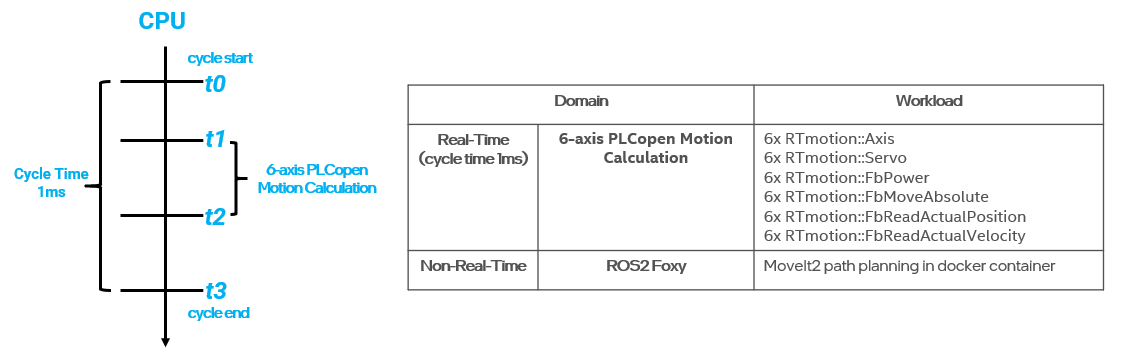
The benchmark uses the PLCopen Motion Control library (RTmotion) and ROS2 MoveIt2 to generate online trajectories for an industrial robotic arm in simulation and measures the jitter and motion execution time of the control workload in each real-time cycle. The goal of this benchmark is to evaluate ECI real-time performance when running ROS2 non-real-time workloads (Path Planning, 3D Visualization, DDS communication). The trajectory of the robotic arm is generated by ROS2 MoveIt2 and contains waypoints, each of which contains the joint [position, velocity, acceleration] targets and a timestamp. The real-time program received the trajectory from MoveIt 2 through the shared memory, and uses PLCopen function blocks to interpolates path between waypoints with 1ms cycle time and interprets each waypoint into servo motor commands.
Install Robotic 6-axis Motion Control Benchmark
You can install this component from the ECI repository. Setup the ECI repository, then perform either of the following commands to install this component:
![]()
![]()
- Install from meta-package
$ sudo apt install eci-softplc-plcopen eci-robotics eci-realtime
- Install from individual Deb package
# For non-Xenomai kernels
$ sudo apt install plcopen-databus libshmringbuf-dev libshmringbuf mc-gateway-hiwin

# For Xenomai kernels
$ sudo apt install plcopen-databus-xenomai libshmringbuf-dev libshmringbuf mc-gateway-hiwin
![]()
Install from individual RPM package
This package is not yet available for Red Hat® Enterprise Linux®.
Execute Robotic 6-axis Motion Control Benchmark
To start the benchmark, follow the instructions in Launch HIWIN 6-axis Robotic Arm ROS2 tutorial.
Interpret Robotic 6-axis Motion Control Benchmark
Axis 0 initialized.
Axis 1 initialized.
Axis 2 initialized.
Axis 3 initialized.
Axis 4 initialized.
Axis 5 initialized.
Function blocks initialized.
Axis #0 powered on, axis_pos_ = 0.000000
Axis #1 powered on, axis_pos_ = 0.000000
Axis #2 powered on, axis_pos_ = 0.000000
Axis #3 powered on, axis_pos_ = 0.000000
Axis #4 powered on, axis_pos_ = 0.000000
Axis #5 powered on, axis_pos_ = 0.000000
^Ccount: 68s
******************************************************
jitter time          4.924...     7.446...    24.842
motion time          0.895...     2.822...    55.255
******************************************************
End of Program
Press crtl+c to stop the real-time PLC program. The jitter time shows the [minimum, average, maximum] values of real-time cycle jitter. The motion time shows the [minimum, average, maximum] execution time of 6-axis PLCopen motion calculation.
ROS2 DDS/RSTP Benchmark
Benchmark |
Units |
Version |
Source |
|---|---|---|---|
ROS2 DDS/RSTP Benchmark |
microseconds |
v1.1.0 (with eci patches) |
About DDS/RSTP Benchmark
The benchmark uses the Robot Operating System Software to evaluate real-time performance of publisher and subscriber DDS/RSTP ROS2 nodes.
The performance_test tool available at gitlab.com/ApexAI tests latency and other performance metrics of various middleware implementations that support a pub/sub pattern. It is used to simulate non-functional performance of your application.
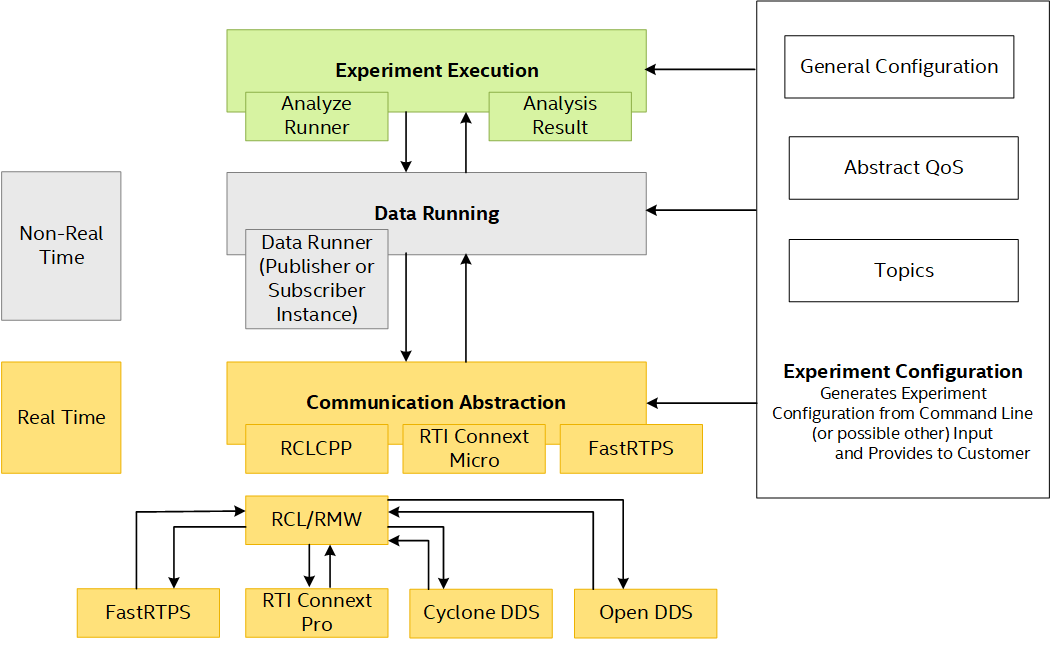
Intel® ECI DDS/RTSP performance_test tool has been patched to add :
New benchmarking KPIs for Industrial Use
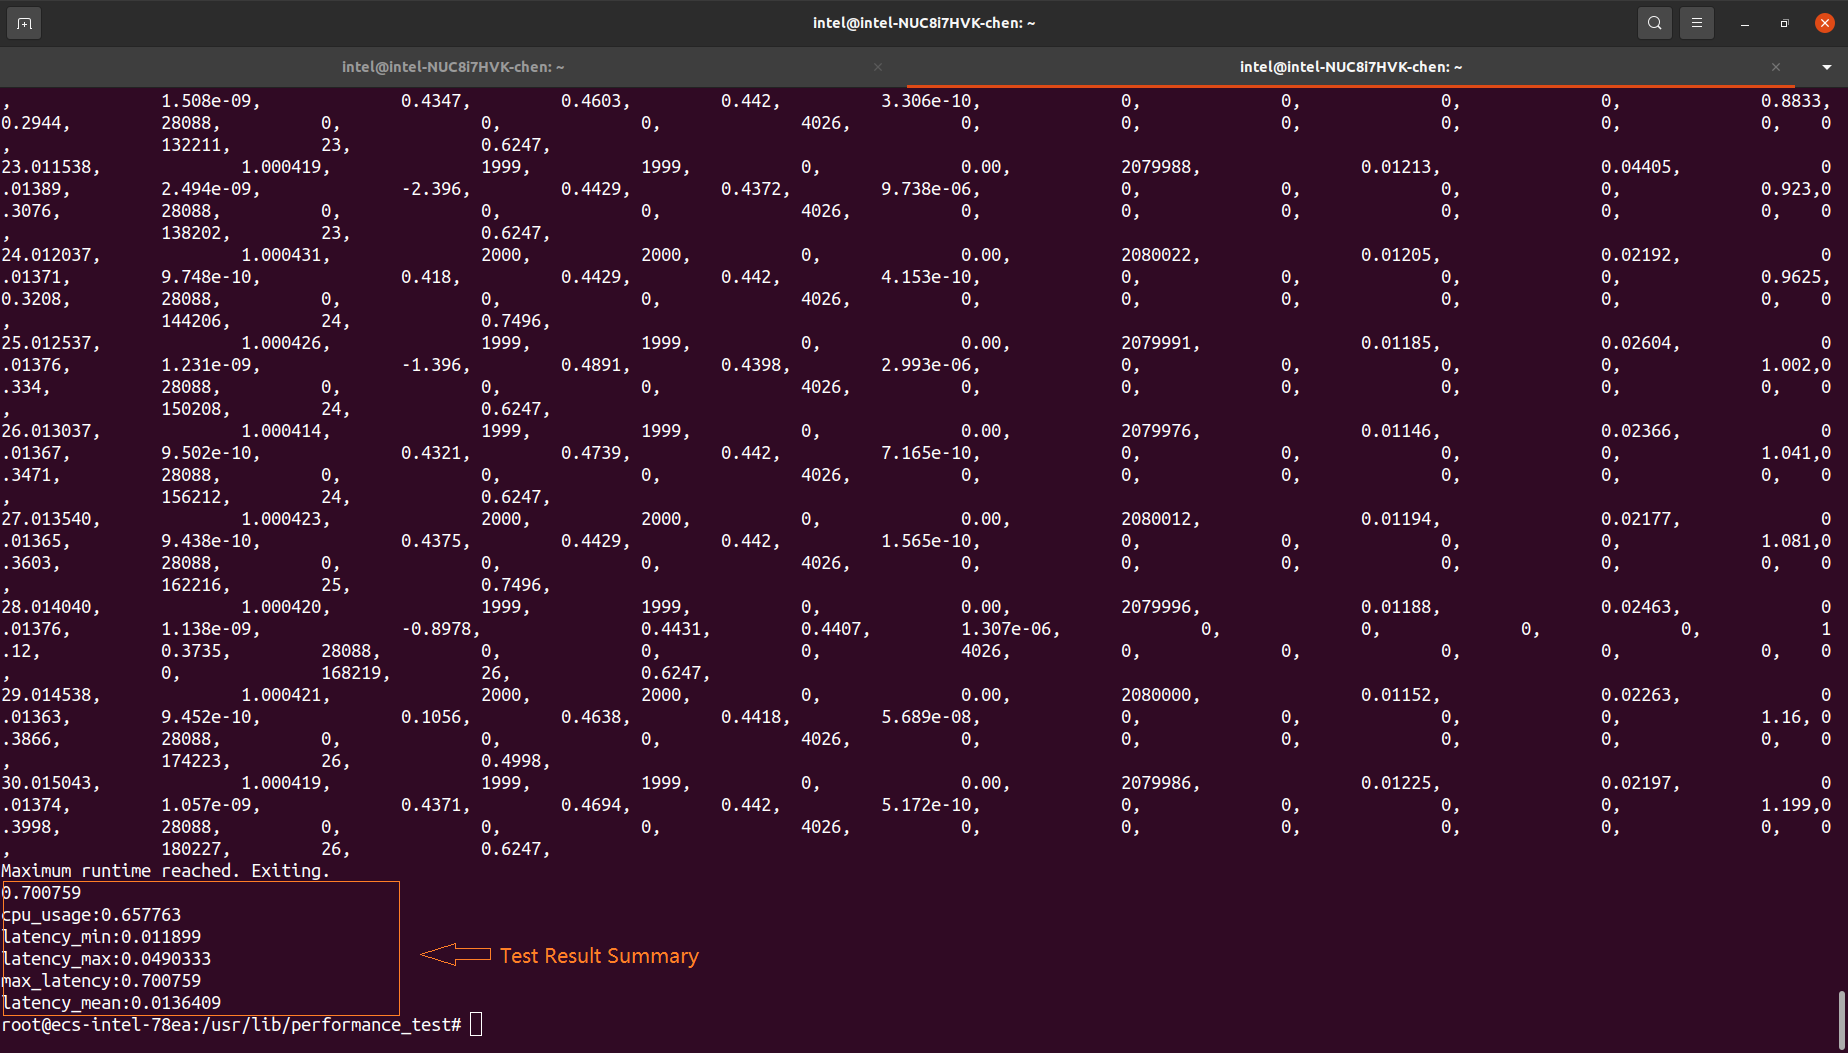
Printed the summary benchmarking results to the console output after testing is done. This allows you to quickly and easily know the performance result. This is beneficial when the target image does not enable graphics features, thus there is no chance to open the benchmarking files (for instance, PDF files).
Printed the worst cases that are unfit for performance requirements (mainly for DDS communication latency). Comparing with the mean value of max-latency, industrial scenarios care more about the worst cases of max-latency.
Optimization for Real-Time
Created DDS profile to enable synchronous DDS communication mode and set up memory allocation policy.
Enable CPU core affinity for ROS or DDS nodes.
Set higher priority for ROS or DDS nodes.
Optimization Results
To demonstrate the optimization status, consider the following test scenario:
Message size of 1KB.
The message is published with the frequency of 2000Hz, sending a message out every 0.5ms.
CPU runs under a test load of 50%.
ROS2 performance was tested on three different hardware platforms, and the following figure compares the performance with and without Intel® optimization.
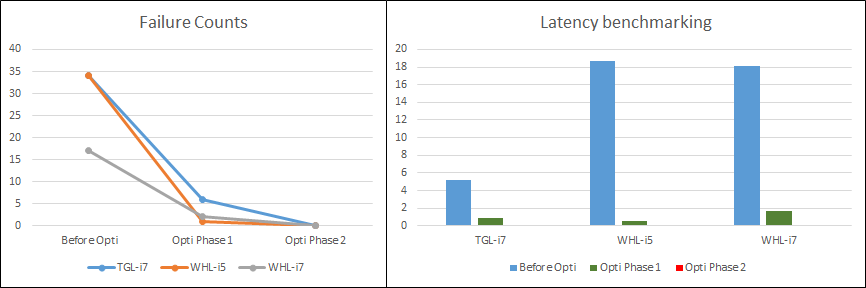
The Failure Counts graph records the number of the message pub/sub cycles that have a latency greater 0.5ms. (In this case, latency is greater than 0.5ms, which means that one or more messages was not received and was not available for further handling).
Install DDS/RSTP Benchmark
You can install this component from the ECI repository. Setup the ECI repository, then perform either of the following commands to install this component:
![]()
![]()
Install ROS2 Core, if not already completed.
Install DDS/RTSP
performance_testtool ROS2 Deb package$ sudo apt install ros-humble-performance-test
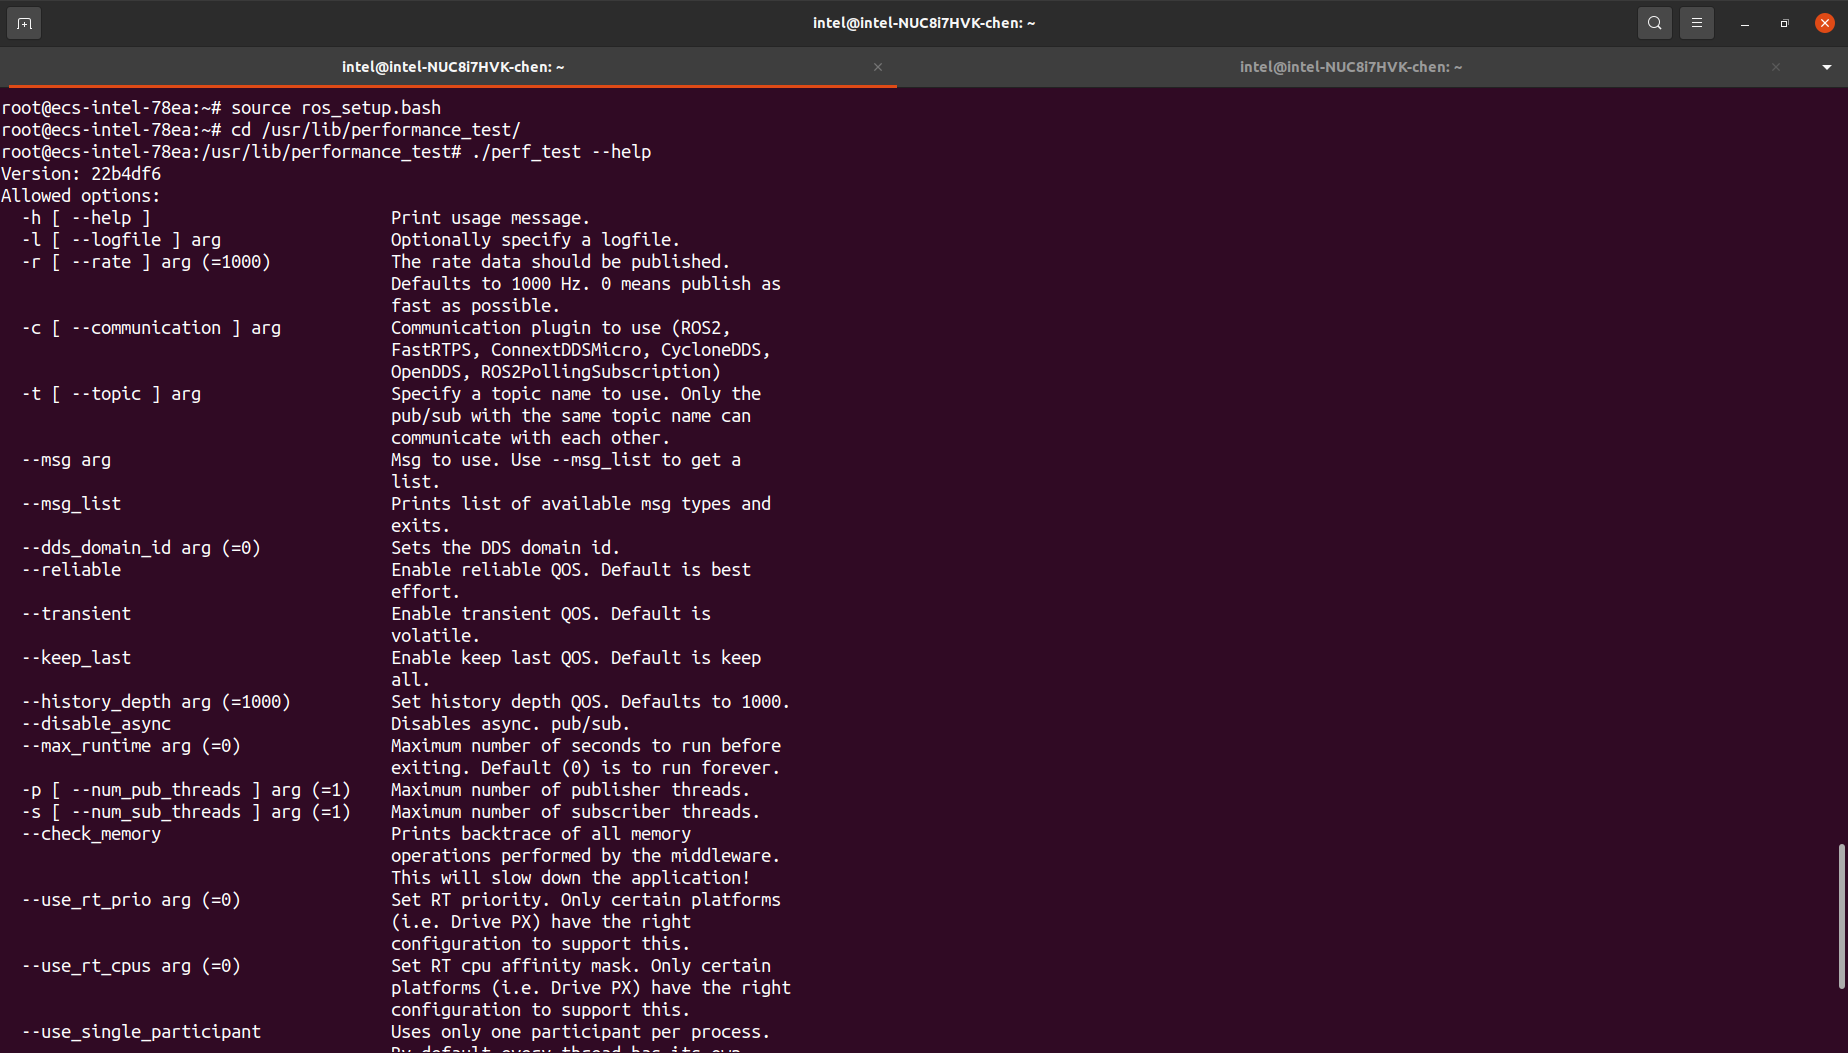
Verify that DDS/RSTP benchmark installed correctly:
$ ros2 run performance_test perf_test --help
![]()
Install from individual RPM package
This package is not yet available for Red Hat® Enterprise Linux®.
Launch DDS/RSTP Benchmark
To start the benchmark, run the following command:
Open a terminal with elevated permissions:
$ sudo -i
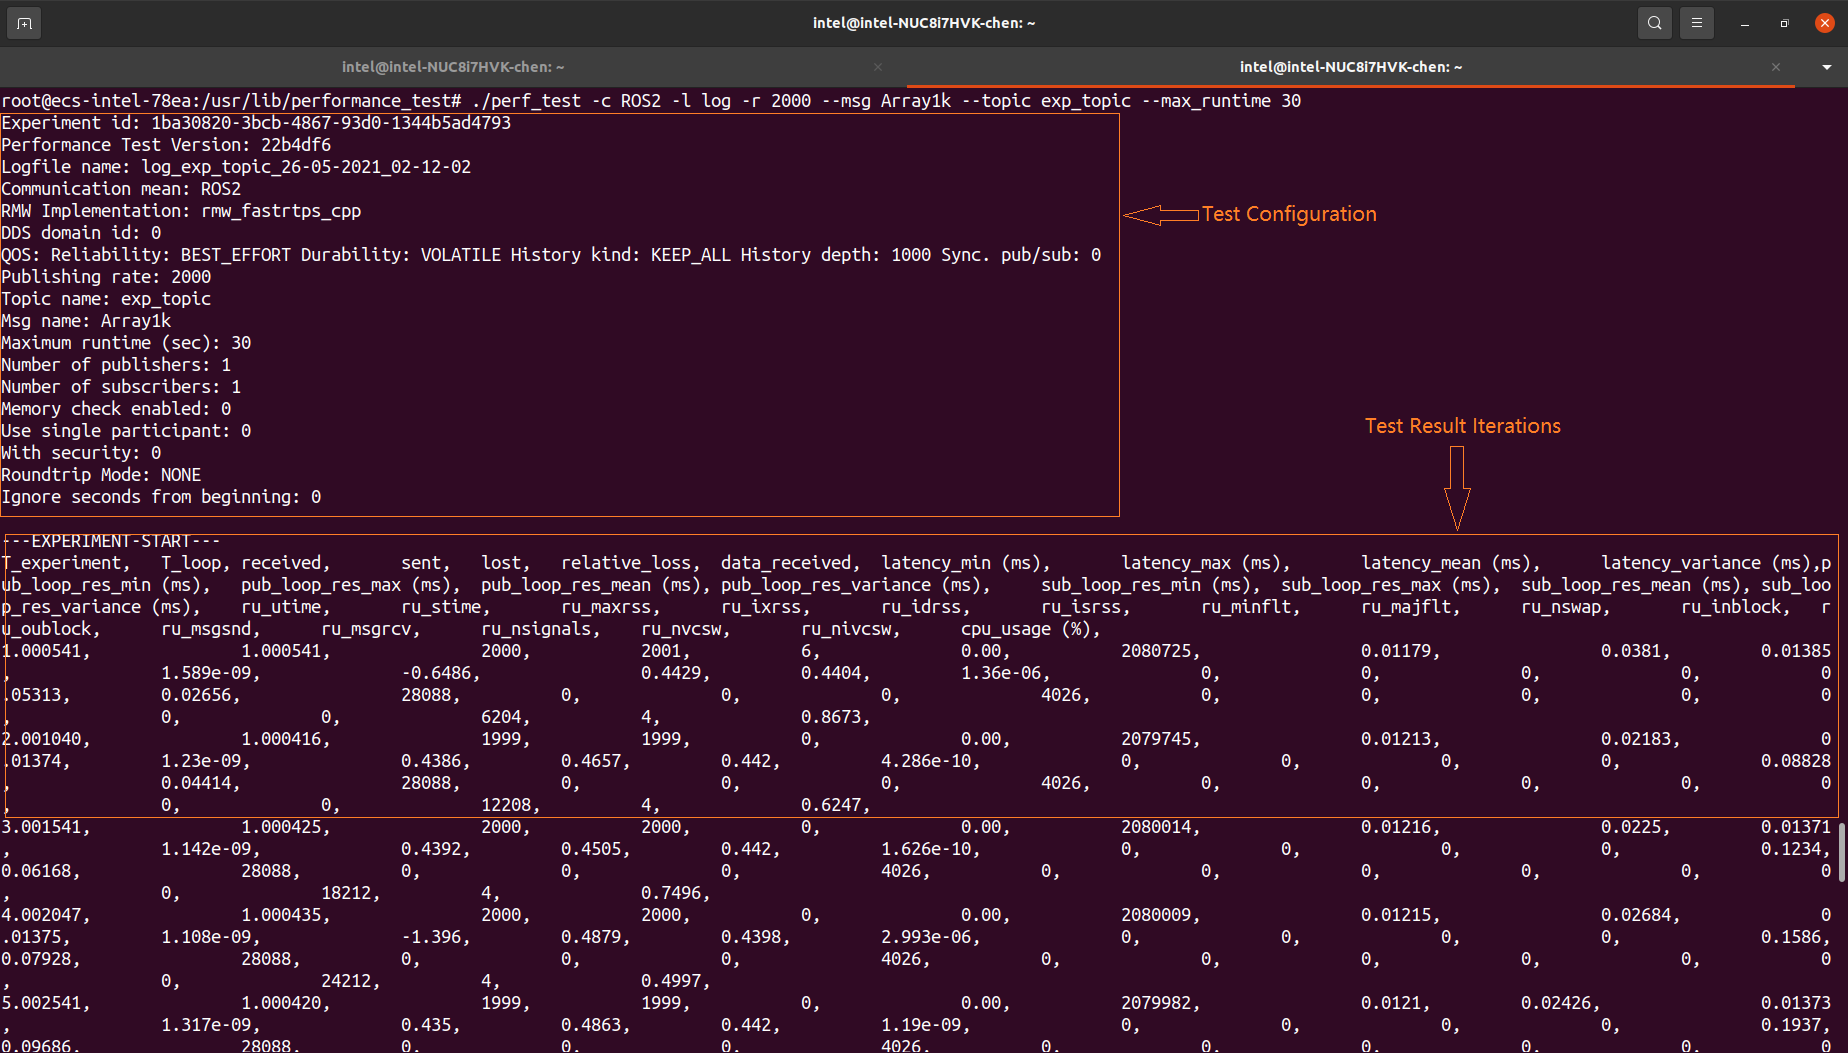
In the terminal, setup the ROS2 environment and run the ROS2 performance test based on the default DDS (eProsima FastDDS) pub/sub execution:
$ source /opt/ros/humble/setup.bash
$ ros2 run performance_test perf_test -o csv -c rclcpp-waitset -l log_waitset_Array1k_10s.csv -r 20 --msg Array1k --topic topic_1k_1 --history KEEP_LAST --use-rt-prio 49 --history-depth 10 --max-runtime 10
Interpret DDS/RSTP Benchmark results
The performance_test tool allows you to quickly set up a pub/sub configuration, for example, number of publisher/subscribers, message size, QoS settings, and middleware.
The following metrics are automatically recorded when the application is running:
- Latency:
Corresponds to the time a message takes to travel from a publisher to subscriber. The latency is measured by timestamping the sample when it is published and subtracting the timestamp (from the sample) from the measured time when the sample arrives at the subscriber.
- CPU usage:
Percentage of the total system-wide CPU usage.
- Resident memory:
Heap allocations, shared memory segments, stack (used for system’s internal work).
- Sample statistics:
Number of samples received, sent, and lost per experiment run.
FLANN Intel oneAPI DPC++ Benchmark
Benchmark |
Units |
Version |
Source |
|---|---|---|---|
FLANN Data Parallel C++ Benchmark |
milliseconds |
v1.9.1 (with eci oneapi patches) |
Intel® created |
About FLANN Intel oneAPI DPC++ Benchmark
FLANN is a 3-D processing library used to search for nearest neighbors in three-dimensional or even higher dimensional space. FLANN builds indices to the input points and provides interfaces to search for the nearest K (number of) or nearest R (radius) neighbors.
The oneAPI DPC++ Compatibility Tool (DPCT) is used to migrate the CUDA implementation into Data Parallel C++ (DPC++) for building and searching the k-dimensional tree. Additionally, some CUDA thrust functions need manual migration. The dimension and size of index space, nd_range of SYCL are adapted according to the hardware device capability of the maximum work-group size. Unified Shared Memory (USM) is used to avoid additional memory copy.
Install FLANN Intel oneAPI DPC++ Benchmark
You can install this component from the ECI repository. Setup the ECI repository, then perform either of the following commands to install this component:
![]()
![]()
Enable Intel® oneAPI DPC++ and OpenMP Compute Runtimes to use acceleration on Intel® Graphics.
Install FLANN DPC++ Test suite:
$ sudo apt install flann-dpcpp-test
![]()
Install from individual RPM package
This package is not yet available for Red Hat® Enterprise Linux®.
Launch FLANN Intel oneAPI DPC++ Benchmark
To start the benchmark, run the following commands:
Run the FLANN Test suite on Intel® GPU via Level-Zero API:
$ cd /opt/intel/flann/dpcpp/tests
$ export SYCL_CACHE_PERSISTENT=1
$ export ONEAPI_DEVICE_SELECTOR=level_zero:gpu
$ ./flanntest_dp  ../data/data_.txt | tee /tmp/flann_test_gpu.log
Run the FLANN Test suite on Intel® CPU:
$ cd /opt/intel/flann/dpcpp/tests
$ export ONEAPI_DEVICE_SELECTOR=opencl:cpu
$ ./flanntest_dp  ../data/data_.txt | tee /tmp/flann_test_cpu.log
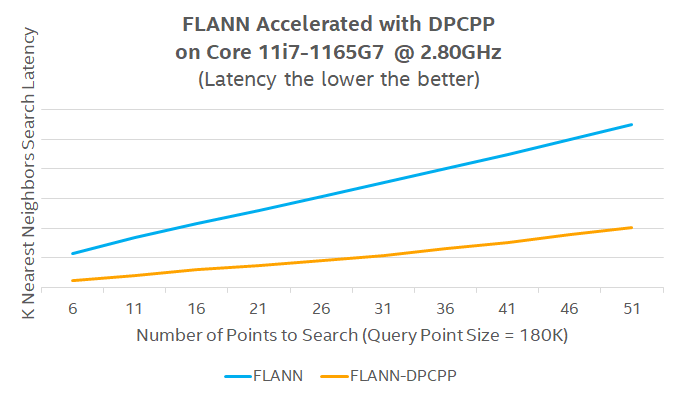
Interpret FLANN Intel® oneAPI DPC++ Benchmark results
FLANN benchmark logs computing latency in milliseconds, for various k and radius values, between Intel® oneAPI DPC++ level0 GPU and plain CPU execution.
Click to view the benchmark results
[----------] 1 test from oneapi_flann_knn_performance_test
[ RUN      ] oneapi_flann_knn_performance_test.Positive
data size is 198273
data size is 191380
====kdtree dpcpp index=======================
create kdtree dpcpp: 98.935 ms
k=2 search kdtree: 50.914 ms
k=7 search kdtree: 62.323 ms
k=12 search kdtree: 97.775 ms
k=17 search kdtree: 167.936 ms
k=22 search kdtree: 232.559 ms
k=27 search kdtree: 284.624 ms
k=32 search kdtree: 330.846 ms
k=37 search kdtree: 388.697 ms
k=42 search kdtree: 447.857 ms
k=47 search kdtree: 508.655 ms
k=52 search kdtree: 568.344 ms
k=57 search kdtree: 627.265 ms
k=62 search kdtree: 716.911 ms
k=67 search kdtree: 743.552 ms
k=72 search kdtree: 829.595 ms
====kdtree single index=======================
create kdtree: 242.245 ms
k=2 search kdtree: 470.504 ms
k=7 search kdtree: 1094.13 ms
k=12 search kdtree: 2334.15 ms
k=17 search kdtree: 3226.63 ms
k=22 search kdtree: 3746.74 ms
k=27 search kdtree: 4113.68 ms
k=32 search kdtree: 4478.92 ms
k=37 search kdtree: 5092.62 ms
k=42 search kdtree: 5856.41 ms
k=47 search kdtree: 6405.64 ms
k=52 search kdtree: 6937.99 ms
k=57 search kdtree: 7455.19 ms
k=62 search kdtree: 8054.9 ms
k=67 search kdtree: 8631.63 ms
k=72 search kdtree: 13356.7 ms
[       OK ] oneapi_flann_knn_performance_test.Positive (89874 ms)
[----------] 1 test from oneapi_flann_knn_performance_test (89874 ms total)
[----------] 1 test from oneapi_flann_radius_performance_test
[ RUN      ] oneapi_flann_radius_performance_test.Positive
data size is 198273
data size is 198273
====kdtree dpcpp index=======================
create kdtree dpcpp: 95.827 ms
radius=0.01 search kdtree: 27.789 ms
radius=0.06 search kdtree: 21.541 ms
radius=0.11 search kdtree: 27.399 ms
radius=0.16 search kdtree: 27.926 ms
radius=0.21 search kdtree: 31.558 ms
radius=0.26 search kdtree: 33.077 ms
radius=0.31 search kdtree: 34.523 ms
radius=0.36 search kdtree: 34.366 ms
radius=0.41 search kdtree: 43.423 ms
radius=0.46 search kdtree: 45.014 ms
radius=0.51 search kdtree: 63.377 ms
radius=0.56 search kdtree: 67.082 ms
radius=0.61 search kdtree: 68.667 ms
radius=0.66 search kdtree: 71.914 ms
radius=0.71 search kdtree: 69.622 ms
====kdtree single index=======================
create kdtree: 337.145 ms
radius=0.01 search kdtree: 451.055 ms
radius=0.06 search kdtree: 451.089 ms
radius=0.11 search kdtree: 607.748 ms
radius=0.16 search kdtree: 625.998 ms
radius=0.21 search kdtree: 705.211 ms
radius=0.26 search kdtree: 730.814 ms
radius=0.31 search kdtree: 726.285 ms
radius=0.36 search kdtree: 745.114 ms
radius=0.41 search kdtree: 868.959 ms
radius=0.46 search kdtree: 908.484 ms
radius=0.51 search kdtree: 1079.77 ms
radius=0.56 search kdtree: 1119.06 ms
radius=0.61 search kdtree: 1127.51 ms
radius=0.66 search kdtree: 1127.1 ms
radius=0.71 search kdtree: 1137.84 ms
[       OK ] oneapi_flann_radius_performance_test.Positive (16587 ms)
[----------] 1 test from oneapi_flann_radius_performance_test (16587 ms total)
[----------] Global test environment tear-down
[==========] 4 tests from 4 test suites ran. (124442 ms total)
[  PASSED  ] 4 tests.
PCL Intel oneAPI DPC++ Benchmark
Benchmark |
Units |
Version |
Source |
|---|---|---|---|
PCL Data Parallel C++ Benchmark |
milliseconds |
v1.12.1 (with eci oneapi patches) |
Intel® created |
About PCL Intel oneAPI DPC++ Benchmark
Point-Cloud Library (PCL) contains common algorithms for 3-D point cloud processing.
For the PCL module with CUDA code, DPCT is used to migrate the CUDA code to DPC++ implementation. For the PCL module without CUDA code, Intel® VTune Profiler is used to identify the performance bottlenecks and OMP is used to enable multi-processing via compiler directives.
Install PCL Intel oneAPI DPC++ Benchmark
You can install this component from the ECI repository. Setup the ECI repository, then perform either of the following commands to install this component:
![]()
![]()
Enable Intel® oneAPI DPC++ and OpenMP Compute Runtimes to use acceleration on Intel® Graphics.
Install PCL oneAPI Test suite:
$ sudo apt install pcl-oneapi-test
![]()
Install from individual RPM package
This package is not yet available for Red Hat® Enterprise Linux®.
Launch PCL Intel oneAPI DPC++ Benchmark
To start the benchmark, run the following commands:
Check that all PCL algorithms run successfully on Intel® GPU via Level-Zero API:
$ cd /opt/intel/pcl/oneapi/tests
$ export SYCL_CACHE_PERSISTENT=1
$ export ONEAPI_DEVICE_SELECTOR=level_zero:gpu
$ find . -name "*test_*" -not -name "*_performance" -not -name "*_perf" -not -name "*greedy*" -exec {} \; | tee /tmp/pcl_functional_test_gpu.log
Important
Consider the known limitations of Intel® Gen9.x Graphics Level0 API call will fail due to data-size hardware offload limits with the following PCL tests:
PCL_OneAPI_Octree.OneAPI_Octree_approxNearestSearchPCL_OneAPI_Octree.OneAPI_Octree_Radius_Search_FunctionPCL_OctreeOneAPI.OneAPI_Octree_KNNSearchPCL_ONEAPI_MLS.test_radius_configurationPCL.SampleConsensusInitialAlignment_DPCPP_CPU
It is recommended to ignore those sub-tests with Intel® Gen9.x Graphics hardware:
$ find . -name "*test_*" -not -name "*_performance" -not -name "*_perf" -not -name "*outlier*" -not -name "*greedy*" -not -name "*octree*" -not -name "*mls*" -not -name "*scia*" -exec {} \; | tee /tmp/pcl_functional_test_gpu.log
Check that all PCL algorithms run successfully on Intel® CPU:
$ cd /opt/intel/pcl/oneapi/tests
$ export SYCL_CACHE_PERSISTENT=1
$ export ONEAPI_DEVICE_SELECTOR=opencl:cpu
$ find . -name "*test_*" -not -name "*_performance" -not -name "*_perf" -not -name "*greedy*" -exec {} \; | tee /tmp/pcl_functional_test_gpu.log
Run individual performances of each oneAPI optimized PCL algorithms alternatively on Intel® GPU via level0 API and Intel® CPU:
$ cd /opt/intel/pcl/oneapi
$ export ONEAPI_DEVICE_SELECTOR=level_zero:gpu
OR
$ cd /opt/intel/pcl/oneapi
$ export ONEAPI_DEVICE_SELECTOR=opencl:cpu
Tests for various algorithms are grouped by tabs below. Select a tab to view test instructions for that algorithm:
Compute latency for Registration algorithms:
$ ./tests/test_oneapi_registration_perf ./data/test_P.pcd ./data/test_Q.pcd
Compute latency for moving sample consensus (SAC-IA and SAC-PR) algorithms:
Important
Consider the known limitations of Intel® Gen9.x Graphics Level0 API call will fail due to data-size hardware offload limits.
$ ./tests/test_oneapi_scia_perf ./data/scia_source.pcd ./data/scia_target.pcd ./data/scia_source_fpfh33.pcd ./data/scia_target_fpfh33.pcd
Compute time for Normal Estimation :
$ ./tests/test_oneapi_features_normals_performance ./data/cturtle.pcd
Compute latency for KdTree algorithms:
$ ./tests/test_oneapi_kdtree_perf ./data/test_P.pcd ./data/test_Q.pcd
Compute latency for various Octree algorithms:
Important
Consider the known limitations of Intel® Gen9.x Graphics Level0 API call will fail due to data-size hardware offload limits.
$ ./tests/test_oneapi_octree_knn_search_performance ./data/test_P.pcd ./data/test_Q.pcd
$ ./tests/test_oneapi_octree_radius_search_performance ./data/test_P.pcd ./data/test_Q.pcd
$ ./tests/test_oneapi_octree_approx_nearest_performance ./data/test_P.pcd ./data/test_Q.pcd
Compute latency for Sample Consensus algorithms:
$ ./tests/test_oneapi_sample_consensus_plane_models_perf ./data/test59.pcd
Compute latency for Segmentation algorithms:
$ ./tests/test_oneapi_segmentation_perf ./data/test59.pcd
Compute latency for maximum length sequence (MLS) algorithms:
Important
Consider the known limitations of Intel® Gen9.x Graphics Level0 API call will fail due to data-size hardware offload limits.
$ ./tests/test_oneapi_mls_performance ./configs/mls_config.yaml
Compute latency for VoxelGrid filter algorithms:
$ ./tests/test_oneapi_voxel_grid_perf ./data/table_scene_lms400.pcd
Compute latency for Filter PassThrough algorithms:
$ ./tests/test_oneapi_passthrough_perf ./data/using_kinfu_large_scale_output.pcd
Compute time for Statistical Outlier removal :
Important
Consider the known limitations of Intel® Gen9.x Graphics Level0 API call may fail due to data-size hardware offload limits.
$ ./tests/test_oneapi_statistical_outlier_removal_perf ./data/cloud.pcd
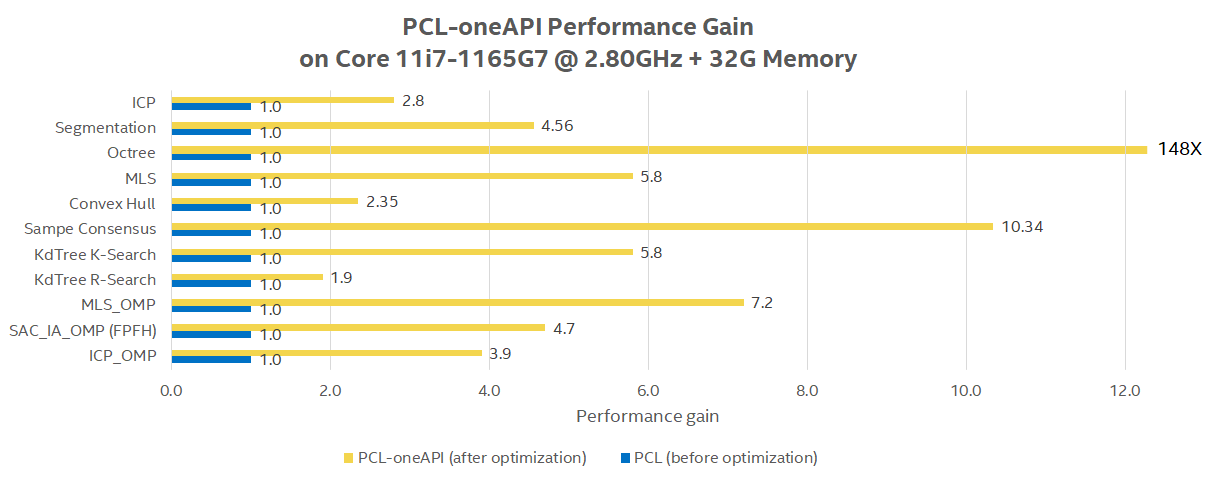
Interpret PCL Intel oneAPI DPC++ Benchmark results
Each PCL benchmarks logs computing latency in milliseconds between Intel® oneAPI DPC++ level0 GPU versus plain CPU execution.
Click to view the benchmark results on KdTree PCL
./tests/test_oneapi_kdtree_perf ./data/test_P.pcd ./data/test_Q.pcd
[==========] Running 7 tests from 1 test suite.
[----------] Global test environment set-up.
[----------] 7 tests from PCL
[ RUN      ] PCL.KdTreeFLANN_radiusSearch
OneAPI time for kdtree radius search 33.1814 milliseconds
CPU time for kdtree radius search 269.944 milliseconds
[       OK ] PCL.KdTreeFLANN_radiusSearch (131366 ms)
[ RUN      ] PCL.KdTreeFLANN_fixedRadiusSearch_native_buffer
OneAPI time for kdtree radius search 27.1908 milliseconds
CPU time for kdtree radius search 267.957 milliseconds
[       OK ] PCL.KdTreeFLANN_fixedRadiusSearch_native_buffer (1535 ms)
[ RUN      ] PCL.KdTreeFLANN_fixedRadiusSearch_std_vector
OneAPI time for kdtree radius search 37.5182 milliseconds
CPU time for kdtree radius search 267.964 milliseconds
[       OK ] PCL.KdTreeFLANN_fixedRadiusSearch_std_vector (1569 ms)
[ RUN      ] PCL.KdTreeFLANN_fixedRadiusSearchUnSort
OneAPI time for kdtree radius search 5.135 milliseconds
CPU time for kdtree radius search 129.396 milliseconds
[       OK ] PCL.KdTreeFLANN_fixedRadiusSearchUnSort (687 ms)
[ RUN      ] PCL.KdTreeFLANN_knnSearch
OneAPI time for kdtree k-nearest neighbor search 1.922 milliseconds
CPU time for kdtree k-nearest neighbor search 35.3504 milliseconds
[       OK ] PCL.KdTreeFLANN_knnSearch (211 ms)
[ RUN      ] PCL.KdTreeFLANN_knnSearch_native_buffer_2d
OneAPI time for kdtree k-nearest neighbor search 2.103 milliseconds
CPU time for kdtree k-nearest neighbor search 35.225 milliseconds
[       OK ] PCL.KdTreeFLANN_knnSearch_native_buffer_2d (207 ms)
[ RUN      ] PCL.KdTreeFLANN_knnSearch_native_buffer_1d
OneAPI time for kdtree k-nearest neighbor search 1.9728 milliseconds
CPU time for kdtree k-nearest neighbor search 35.8558 milliseconds
[       OK ] PCL.KdTreeFLANN_knnSearch_native_buffer_1d (210 ms)
[----------] 7 tests from PCL (135785 ms total)
[----------] Global test environment tear-down
[==========] 7 tests from 1 test suite ran. (135785 ms total)
[  PASSED  ] 7 tests.
Performance Sanity Check Testing
For step-by-step instructions on using the various benchmarks, refer to Performance Sanity Check Testing.