Use Linux Events Tracing (ftrace) to Report Latency Outliers
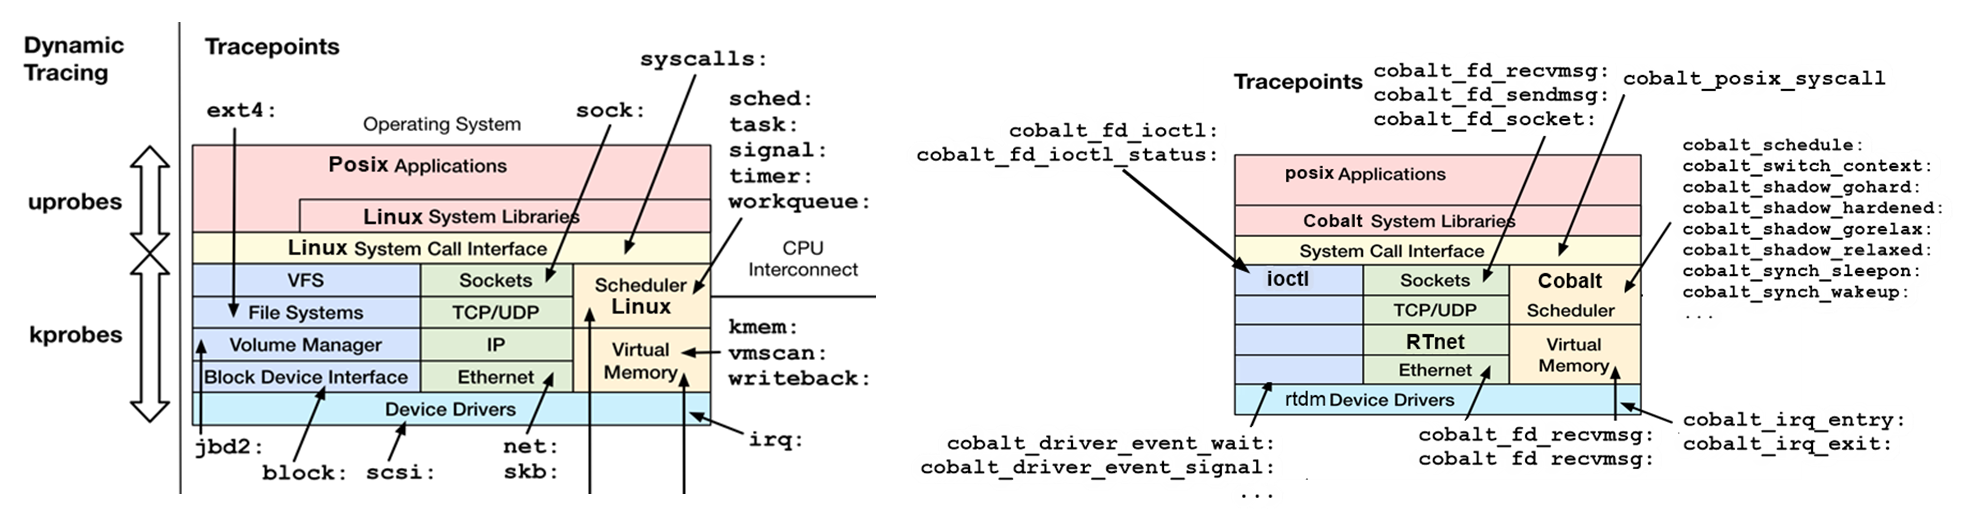
Linux* real-time communities use best-known-methods to enable trace-event in PREEMPT_RT and XENOMAI OS runtime, also known as tracepoints.
Linux* system events tracing is built-in with every Linux* Intel® Debian* image, however it must be enabled on certain Linux* distribution configurations:

Review the kernel configuration actively running:
$ zcat /proc/config.gz | less
If not, review any kernel alternative already installed:
$ cat /boot/config-5.10.0-16-amd64 | less
Check if the kernel configuration enables the following items:
# Add Tracers and Events
CONFIG_TRACING=y
CONFIG_TRACEPOINTS=y
CONFIG_TRACING_SUPPORT=y
CONFIG_HIST_TRIGGERS=y
CONFIG_EVENT_TRACING=y
CONFIG_DYNAMIC_FTRACE=y
CONFIG_FUNCTION_TRACER=y
CONFIG_KPROBE_EVENTS=y
CONFIG_PROBE_EVENTS=y

# Add Kernel Probe
CONFIG_KPROBES=y
CONFIG_JUMP_LABEL=y
CONFIG_KPROBES_ON_FTRACE=y
CONFIG_KRETPROBES=y
CONFIG_USER_RETURN_NOTIFIER=y
CONFIG_HAVE_IOREMAP_PROT=y
CONFIG_HAVE_KPROBES=y
CONFIG_HAVE_KRETPROBES=y
CONFIG_HAVE_KPROBES_ON_FTRACE=y
Linux Events Tracing
The Linux* trace events can be enabled to troubleshoot multi-thread scheduling issues. For example:
Linux* thread scheduling FSM representation using
sched_switchandsched_wakeupeventsLinux* interrupt handlers top-half and threaded bottom-half representation using all
irqeventsLinux* CPU idle and frequency representation using
cpu_idle, andclock_set_rateandcpu_frequencyeventsLinux* kernel drivers work-queues job representation using all
workqueueevents
This translates into the following commands:
Enable ONLY the relevant events among all
/sys/kernel/debug/tracing/available_events:$ echo 1 > /sys/kernel/debug/tracing/events/sched/sched_switch/enable $ echo 1 > /sys/kernel/debug/tracing/events/sched/sched_wakeup/enable $ echo 1 > /sys/kernel/debug/tracing/events/power/cpu_idle/enable $ echo 1 > /sys/kernel/debug/tracing/events/power/cpu_frequency/enable $ echo 1 > /sys/kernel/debug/tracing/events/power/clock_set_rate/enable $ echo 1 > /sys/kernel/debug/tracing/events/workqueue/enable $ echo 1 > /sys/kernel/debug/tracing/events/irq/enable $ echo 100000 > /sys/kernel/debug/tracing/buffer_size_kb $ echo 1 > /sys/kernel/debug/tracing/options/record-tgid $ echo 0 > /sys/kernel/debug/tracing/options/overwrite $ echo global > /sys/kernel/debug/tracing/trace_clock
Clean buffer and start a new trace record:
$ echo > /sys/kernel/debug/tracing/trace
$ echo 1 > /sys/kernel/debug/tracing/tracing_on
Stop trace and redirect
stdouttrace buffer to a temporary file:$ echo 0 > /sys/kernel/debug/tracing/tracing_on $ cat /sys/kernel/debug/tracing/trace > /tmp/trace.txt

Download
trace.txtfile to a computer, open timeviewer HTML page, load (or dragging and dropping) to represent TSN events timeline, and perform a deep-dive analysis.Note: Google* Chrome/Chromium or Microsoft* Edge are recommended. Opera* and Safari* browsers were not tried, but are potential alternatives. Firefox* may be slow. Microsoft IE browser is not compatible.
Disable all system trace events:
$ echo 0 | tee $(find /sys/kernel/debug/tracing/events -name enable | xargs grep 1 | cut -d ":" -f1)
Linux Events Latency Histograms
Important
If CONFIG_HIST_TRIGGERS and CONFIG_PROBE_EVENTS are enabled, refer to kernel tracing.
A more advanced usage model can leverage Linux system events as synthetic trace-event and combine it with hist:keys trigger to add time-variable condition with every event recorded and reduce the record for long-runs to ONLY specific events under particular OS runtime conditions.
Example 1: Measuring af_packet ``sendmsg()`` Outliers
If you require a custom record containing every af_packet and the sendmsg() function is ONLY called by the rt-comms thread (for example, txrx-tsn), then:
Add one dynamic event (kprobe) at the entry of
packet_sendmsg()Add one dynamic event at the return of
packet_sendmsg()Configure the trigger on the
packet_sendmsg()function, call entry event, and collect the timestamp in microsecondsConfigure the trigger on the
packet_sendmsg()function, call return event, and calculate the latency
This translates into the following commands:
Filter all functions except
packet_sendmsgand probe event entry and return:$ echo 0 >/sys/kernel/debug/tracing/tracing_on $ echo >/sys/kernel/debug/tracing/trace > /dev/null $ echo "nop" >/sys/kernel/debug/tracing/current_tracer > /dev/null $ echo "packet_sendmsg" >/sys/kernel/debug/tracing/set_ftrace_filter $ perf probe packet_sendmsg $ perf probe -f packet_sendmsg%return
Create a synthetic_event ->
packet_sendmsg_latency(int pid, u64 latency):$ echo 'packet_sendmsg_latency int pid; u64 lat' > /sys/kernel/debug/tracing/synthetic_events $ echo 'hist:keys=common_pid:ts0=common_timestamp.usecs if comm=="txrx-tsn"' \ >/sys/kernel/debug/tracing/events/probe/packet_sendmsg/trigger $ echo 'hist:keys=common_pid:sendmsg_latency=common_timestamp.usecs-$ts0:onmatch(probe.packet_sendmsg).packet_sendmsg_latency(common_pid,$sendmsg_latency) if comm=="txrx-tsn"' \ > /sys/kernel/debug/tracing/events/probe/packet_sendmsg__return/trigger $ echo 'hist:keys=lat:sort=lat'> /sys/kernel/debug/tracing/events/synthetic/packet_sendmsg_latency/trigger
Run the application (for example, txrx-tsn) with tracing enabled and report af_packet transfer of
synthetic_eventas latency histogram:$ cd /opt/intel/iotg_tsn_ref_sw $ echo 1 > /sys/kernel/debug/tracing/tracing_on && \ $ taskset -c 1 ./txrx-tsn -v -i enp3s0 -t -P -l 64 -q 1 > /tmp/igb-afpk1a_no-offload.txt && \ $ echo 0 > /sys/kernel/debug/tracing/tracing_on $ cat /sys/kernel/debug/tracing/events/synthetic/packet_sendmsg_latency/hist
Click to toggle Example output
# event histogram
#
# trigger info: hist:keys=pid,lat:vals=hitcount:sort=pid,lat:size=2048 [active]
#

{ pid:       1875, lat:          6 } hitcount:          1
{ pid:       1875, lat:          7 } hitcount:          2
{ pid:       1875, lat:         10 } hitcount:          3
{ pid:       1875, lat:         11 } hitcount:       4239
{ pid:       1875, lat:         12 } hitcount:      13782
{ pid:       1875, lat:         13 } hitcount:       1282
{ pid:       1875, lat:         14 } hitcount:        706
{ pid:       1875, lat:         15 } hitcount:         54
{ pid:       1875, lat:         16 } hitcount:         12
{ pid:       1875, lat:         17 } hitcount:         15
{ pid:       1875, lat:         18 } hitcount:         13
{ pid:       1875, lat:         19 } hitcount:          4
{ pid:       1875, lat:         20 } hitcount:          5
{ pid:       1875, lat:         21 } hitcount:          6
{ pid:       1875, lat:         22 } hitcount:          3
{ pid:       1875, lat:         23 } hitcount:          4
{ pid:       1875, lat:         24 } hitcount:          3
{ pid:       1875, lat:         25 } hitcount:          5
{ pid:       1875, lat:         26 } hitcount:          4
{ pid:       1875, lat:         27 } hitcount:          1
{ pid:       1875, lat:         28 } hitcount:          2
{ pid:       1875, lat:         29 } hitcount:          1
{ pid:       1875, lat:         30 } hitcount:          1

Totals:
    Hits: 20149
    Entries: 23
    Dropped: 0
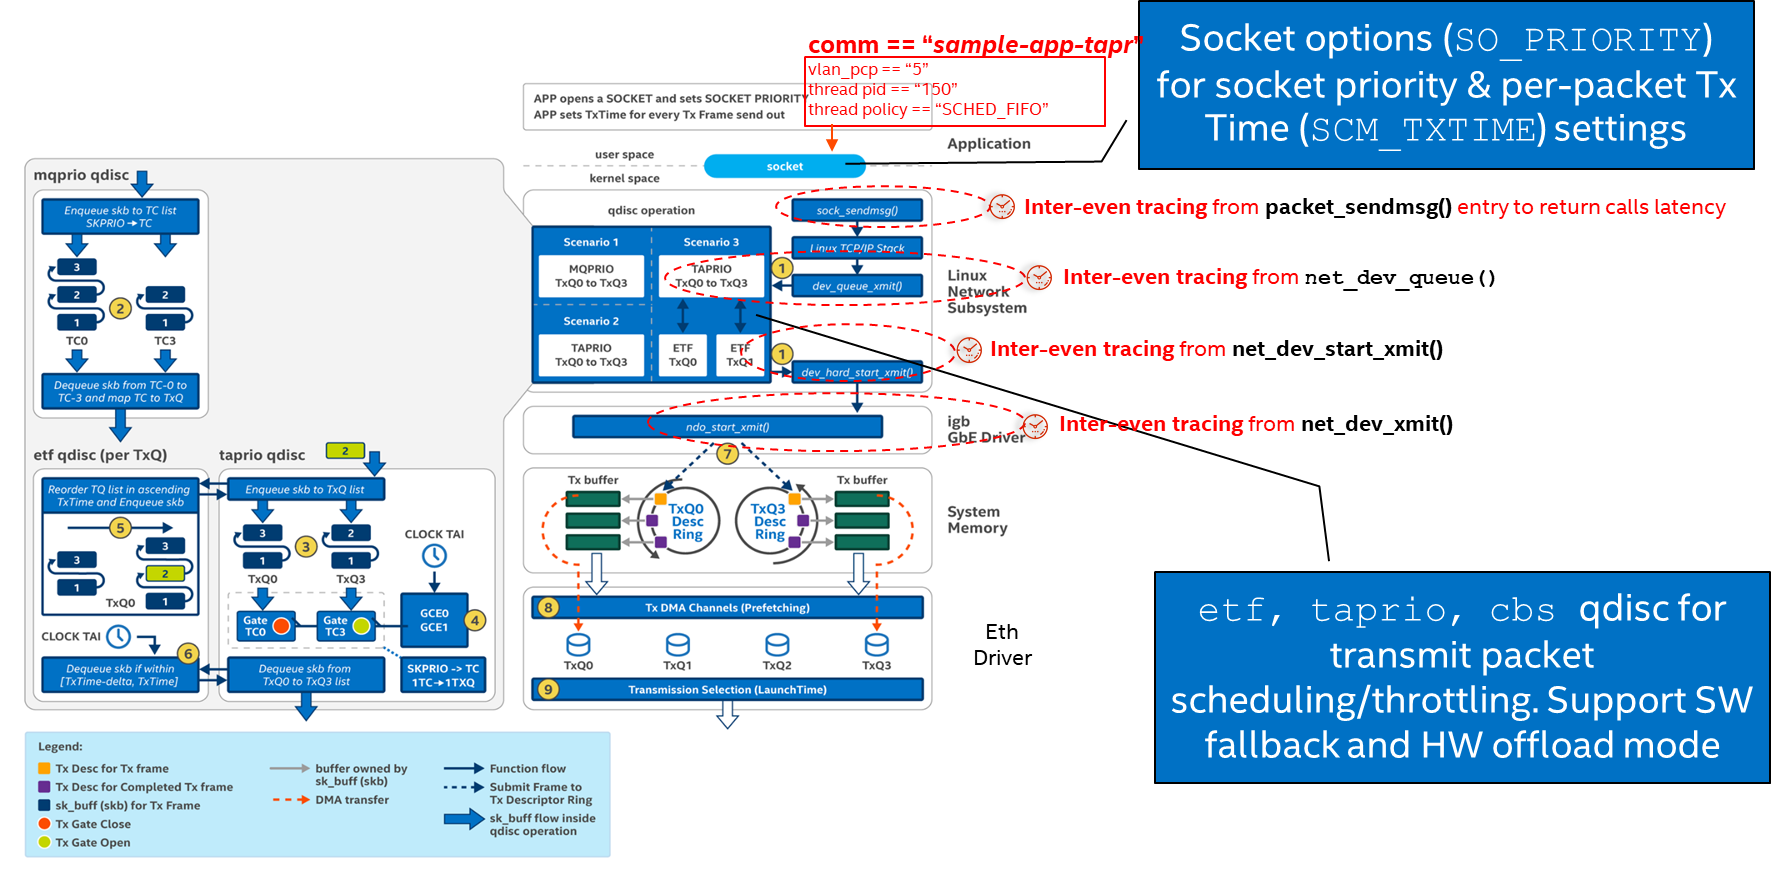
Example 2: Measuring af_packet Inter-event Outliers
If you need a custom record, breaking down individual latency contribution across multiple kernel functions for every af_packet, and the sendmsg() function is ONLY called by the rt-comms thread (for example, txrx-tsn), then:
Add one dynamic event (kprobe) at the entry of
packet_sendmsg()Add one dynamic event at the return of
packet_sendmsg()Configure the trigger on the
packet_sendmsg()function, call entry event, and collect the timestamp in usecsConfigure the trigger on the kernel network events
net_dev_queue,net_dev_start_xmit, andnet_dev_xmitand calculate the latency
This translates into the following commands:
Filter all functions except
packet_sendmsgand probe event entry and return:$ echo 0 >/sys/kernel/debug/tracing/tracing_on $ echo >/sys/kernel/debug/tracing/trace > /dev/null $ echo "nop" >/sys/kernel/debug/tracing/current_tracer > /dev/null $ echo "packet_sendmsg" >/sys/kernel/debug/tracing/set_ftrace_filter $ perf probe packet_sendmsg $ perf probe -f packet_sendmsg%return
Create a synthetic_event ->
latency(int pid, u64 latency)for function call (packet_sendmsg) and kernel network events (net_dev_queue,net_dev_start_xmit, andnet_dev_xmit):Run the application (for example, txrx-tsn) with tracing enabled and report inter-event latency histogram:
$ cd /opt/intel/iotg_tsn_ref_sw/

$ echo > /sys/kernel/debug/tracing/trace && \
$ echo 1 > /sys/kernel/debug/tracing/tracing_on && \
$ taskset -c 1 ./txrx-tsn -v -i enp3s0 -t -P -l 64 -q 1 > /tmp/igb-afpk1a_no-offload.txt && \
$ echo 0 > /sys/kernel/debug/tracing/tracing_on

$ cat /sys/kernel/debug/tracing/events/synthetic/net_proto_latency/hist
$ cat /sys/kernel/debug/tracing/events/synthetic/net_startxmit_latency/hist
$ cat /sys/kernel/debug/tracing/events/synthetic/net_xmit_latency/hist
$ cat /sys/kernel/debug/tracing/events/synthetic/packet_sendmsg_latency/hist
Click to toggle Example output
net_proto_latency
# event histogram
#
# trigger info: hist:keys=pid,lat:vals=hitcount:sort=pid,lat:size=2048 [active]
#

{ pid:       1784, lat:          4 } hitcount:         50
{ pid:       1784, lat:          5 } hitcount:      13612
{ pid:       1784, lat:          6 } hitcount:       5941
{ pid:       1784, lat:          7 } hitcount:        818
{ pid:       1784, lat:          8 } hitcount:         62
{ pid:       1784, lat:          9 } hitcount:         12
{ pid:       1784, lat:         10 } hitcount:          3
{ pid:       1784, lat:         11 } hitcount:          2
{ pid:       1784, lat:         12 } hitcount:          3
{ pid:       1784, lat:         13 } hitcount:          3
{ pid:       1784, lat:         14 } hitcount:          4
{ pid:       1784, lat:         15 } hitcount:          1
{ pid:       1784, lat:         16 } hitcount:          3
{ pid:       1784, lat:         17 } hitcount:          3

Totals:
    Hits: 20517
    Entries: 14
    Dropped: 0


net_startxmit_latency
# event histogram
#
# trigger info: hist:keys=pid,lat:vals=hitcount:sort=pid,lat:size=2048 [active]
#

{ pid:       1784, lat:          8 } hitcount:       8764
{ pid:       1784, lat:          9 } hitcount:      11587
{ pid:       1784, lat:         10 } hitcount:         92
{ pid:       1784, lat:         11 } hitcount:          8
{ pid:       1784, lat:         12 } hitcount:         17
{ pid:       1784, lat:         13 } hitcount:         14
{ pid:       1784, lat:         14 } hitcount:         12
{ pid:       1784, lat:         15 } hitcount:          7
{ pid:       1784, lat:         16 } hitcount:          6
{ pid:       1784, lat:         17 } hitcount:          2
{ pid:       1784, lat:         18 } hitcount:          4
{ pid:       1784, lat:         19 } hitcount:          1
{ pid:       1784, lat:         20 } hitcount:          1
{ pid:       1784, lat:         22 } hitcount:          1
{ pid:       1784, lat:         24 } hitcount:          1

Totals:
    Hits: 20517
    Entries: 15
    Dropped: 0


net_xmit_latency
# event histogram
#
# trigger info: hist:keys=pid,lat:vals=hitcount:sort=pid,lat:size=2048 [active]
#

{ pid:       1784, lat:          3 } hitcount:      10619
{ pid:       1784, lat:          4 } hitcount:       9847
{ pid:       1784, lat:          5 } hitcount:         32
{ pid:       1784, lat:          6 } hitcount:          8
{ pid:       1784, lat:          8 } hitcount:          2
{ pid:       1784, lat:          9 } hitcount:          3
{ pid:       1784, lat:         10 } hitcount:          1
{ pid:       1784, lat:         11 } hitcount:          2
{ pid:       1784, lat:         12 } hitcount:          1
{ pid:       1784, lat:         13 } hitcount:          1
{ pid:       1784, lat:         14 } hitcount:          1

Totals:
    Hits: 20517
    Entries: 11
    Dropped: 0


packet_sendmsg_latency
# event histogram
#
# trigger info: hist:keys=pid,lat:vals=hitcount:sort=pid,lat:size=2048 [active]
#

{ pid:       1784, lat:          3 } hitcount:       5921
{ pid:       1784, lat:          4 } hitcount:      14511
{ pid:       1784, lat:          5 } hitcount:         39
{ pid:       1784, lat:          6 } hitcount:         24
{ pid:       1784, lat:          7 } hitcount:          6
{ pid:       1784, lat:          8 } hitcount:          4
{ pid:       1784, lat:          9 } hitcount:          5
{ pid:       1784, lat:         10 } hitcount:          7

Totals:
    Hits: 20517
    Entries: 8
    Dropped: 0
Add synthetic events to trace events logging to further investigate latency outliers:
$ echo 1 > /sys/kernel/debug/tracing/events/synthetic/packet_sendmsg_latency/enable
$ echo 1 > /sys/kernel/debug/tracing/events/synthetic/net_proto_latency/enable
$ echo 1 > /sys/kernel/debug/tracing/events/synthetic/net_startxmit_latency/enable
$ echo 1 > /sys/kernel/debug/tracing/events/synthetic/net_xmit_latency/enable
Click to toggle Example output
# tracer: nop
#
# entries-in-buffer/entries-written: 4000/4000   #P:4
#
#                                          _-------=> irqs-off
#                                         / _------=> need-resched
#                                        | / _-----=> need-resched-lazy
#                                        || / _----=> hardirq/softirq
#                                        ||| / _---=> preempt-depth
#                                        |||| / _--=> preempt-lazy-depth
#                                        ||||| / _-=> migrate-disable
#                                        |||||| /     delay
#           TASK-PID       TGID    CPU#  |||||||  TIMESTAMP  FUNCTION
#              | |           |       |   |||||||      |         |
        txrx-tsn-24071   (  24071) [001] ....212 58055.400670: net_proto_latency: pid=24071 lat=17
        txrx-tsn-24071   (  24071) [001] ....215 58055.400691: net_startxmit_latency: pid=24071 lat=26
        txrx-tsn-24071   (  24071) [001] .N..215 58055.400725: net_xmit_latency: pid=24071 lat=19
        txrx-tsn-24071   (  24071) [001] dN..3.. 58055.400767: packet_sendmsg_latency: pid=24071 lat=56
        txrx-tsn-24071   (  24071) [001] ....212 58055.401220: net_proto_latency: pid=24071 lat=11
        txrx-tsn-24071   (  24071) [001] ....215 58055.401230: net_startxmit_latency: pid=24071 lat=12
        txrx-tsn-24071   (  24071) [001] ....215 58055.401240: net_xmit_latency: pid=24071 lat=9
        txrx-tsn-24071   (  24071) [001] d...3.. 58055.401246: packet_sendmsg_latency: pid=24071 lat=7
        txrx-tsn-24071   (  24071) [001] ....212 58055.401324: net_proto_latency: pid=24071 lat=6
        txrx-tsn-24071   (  24071) [001] ....215 58055.401333: net_startxmit_latency: pid=24071 lat=9
        txrx-tsn-24071   (  24071) [001] ....215 58055.401339: net_xmit_latency: pid=24071 lat=7
        txrx-tsn-24071   (  24071) [001] d...3.. 58055.401345: packet_sendmsg_latency: pid=24071 lat=5
        txrx-tsn-24071   (  24071) [001] ....212 58055.401416: net_proto_latency: pid=24071 lat=6
        txrx-tsn-24071   (  24071) [001] ....215 58055.401424: net_startxmit_latency: pid=24071 lat=7
        txrx-tsn-24071   (  24071) [001] ....215 58055.401429: net_xmit_latency: pid=24071 lat=7
        txrx-tsn-24071   (  24071) [001] d...3.. 58055.401434: packet_sendmsg_latency: pid=24071 lat=4
        txrx-tsn-24071   (  24071) [001] ....212 58055.401505: net_proto_latency: pid=24071 lat=6
        txrx-tsn-24071   (  24071) [001] ....215 58055.401512: net_startxmit_latency: pid=24071 lat=7
        txrx-tsn-24071   (  24071) [001] ....215 58055.401518: net_xmit_latency: pid=24071 lat=6
        txrx-tsn-24071   (  24071) [001] d...3.. 58055.401523: packet_sendmsg_latency: pid=24071 lat=5
        txrx-tsn-24071   (  24071) [001] ....212 58055.401596: net_proto_latency: pid=24071 lat=7
        txrx-tsn-24071   (  24071) [001] ....215 58055.401604: net_startxmit_latency: pid=24071 lat=8
        txrx-tsn-24071   (  24071) [001] ....215 58055.401609: net_xmit_latency: pid=24071 lat=7
        txrx-tsn-24071   (  24071) [001] d...3.. 58055.401613: packet_sendmsg_latency: pid=24071 lat=4
        txrx-tsn-24071   (  24071) [001] ....212 58055.401687: net_proto_latency: pid=24071 lat=8
        txrx-tsn-24071   (  24071) [001] ....215 58055.401694: net_startxmit_latency: pid=24071 lat=8
        txrx-tsn-24071   (  24071) [001] ....215 58055.401699: net_xmit_latency: pid=24071 lat=6
        txrx-tsn-24071   (  24071) [001] d...3.. 58055.401704: packet_sendmsg_latency: pid=24071 lat=4
        txrx-tsn-24071   (  24071) [001] ....212 58055.401776: net_proto_latency: pid=24071 lat=7
        txrx-tsn-24071   (  24071) [001] ....215 58055.401782: net_startxmit_latency: pid=24071 lat=7
        txrx-tsn-24071   (  24071) [001] ....215 58055.401788: net_xmit_latency: pid=24071 lat=6
        txrx-tsn-24071   (  24071) [001] d...3.. 58055.401792: packet_sendmsg_latency: pid=24071 lat=5
Disable tracing and clean inter-event latency histogram:
$ echo '!hist:keys=pid,lat:sort=pid,lat' >> /sys/kernel/debug/tracing/events/synthetic/packet_sendmsg_latency/trigger
$ echo '!hist:keys=pid,lat:sort=pid,lat' >> /sys/kernel/debug/tracing/events/synthetic/net_proto_latency/trigger
$ echo '!hist:keys=pid,lat:sort=pid,lat' >> /sys/kernel/debug/tracing/events/synthetic/net_startxmit_latency/trigger
$ echo '!hist:keys=pid,lat:sort=pid,lat' >> /sys/kernel/debug/tracing/events/synthetic/net_xmit_latency/trigger

$ echo '!hist:keys=common_pid:sendmsg_latency=common_timestamp.usecs-$ts3:onmatch(net.net_dev_xmit).packet_sendmsg_latency(common_pid,$sendmsg_latency) if comm=="txrx-tsn"' \
    > /sys/kernel/debug/tracing/events/probe/packet_sendmsg__return/trigger
$ echo '!hist:keys=common_pid:ts3=common_timestamp.usecs:xmit_latency=$ts3-$ts2:onmatch(net.net_dev_start_xmit).net_xmit_latency(common_pid,$xmit_latency) if comm=="txrx-tsn"' \
    > /sys/kernel/debug/tracing/events/net/net_dev_xmit/trigger
$ echo '!hist:keys=common_pid:ts2=common_timestamp.usecs:startxmit_latency=$ts2-$ts1:onmatch(net.net_dev_queue).net_startxmit_latency(common_pid,$startxmit_latency) if comm=="txrx-tsn"' \
    > /sys/kernel/debug/tracing/events/net/net_dev_start_xmit/trigger
$ echo '!hist:keys=common_pid:ts1=common_timestamp.usecs:proto_latency=$ts1-$ts0:onmatch(probe.packet_sendmsg).net_proto_latency(common_pid,$proto_latency) if comm=="txrx-tsn"' \
    > /sys/kernel/debug/tracing/events/net/net_dev_queue/trigger
$ echo '!hist:keys=common_pid:ts0=common_timestamp.usecs if comm=="txrx-tsn"' \
    > /sys/kernel/debug/tracing/events/probe/packet_sendmsg/trigger

$ echo 0 >> /sys/kernel/debug/tracing/events/synthetic/packet_sendmsg_latency/enable
$ echo 0 >> /sys/kernel/debug/tracing/events/synthetic/net_proto_latency/enable
$ echo 0 >> /sys/kernel/debug/tracing/events/synthetic/net_startxmit_latency/enable
$ echo 0 >> /sys/kernel/debug/tracing/events/synthetic/net_xmit_latency/enable

$ echo '!packet_sendmsg_latency int pid; u64 lat;' >> /sys/kernel/debug/tracing/synthetic_events
$ echo '!net_proto_latency int pid; u64 lat;' >> /sys/kernel/debug/tracing/synthetic_events
$ echo '!net_startxmit_latency int pid; u64 lat;' >> /sys/kernel/debug/tracing/synthetic_events
$ echo '!net_xmit_latency int pid; u64 lat;' >> /sys/kernel/debug/tracing/synthetic_events

$ perf probe --del packet_sendmsg
$ perf probe --del packet_sendmsg__return
$ echo > /sys/kernel/debug/tracing/set_ftrace_filter
$ echo >/sys/kernel/debug/tracing/trace > /dev/null