System Performance Characterization
The following section is applicable to:

Mega Benchmark
Benchmark |
Units |
Version |
Source |
|---|---|---|---|
Mega Benchmark |
(See respective benchmark) |
1.5 |
Intel Created |
The ECI Mega Benchmark exercises the following tests:
Rhealstone xLatency
Rhealstone Stress Test
To start the benchmark, run the following command:
$ /opt/benchmarking/mega_benchmark.sh
Results are logged to a file named: results_mega_benchmark_<date>
Cyclictest Workload
Benchmark |
Units |
Version |
Source |
|---|---|---|---|
Cyclictest |
microseconds |
1.50 |
https://git.kernel.org/pub/scm/utils/rt-tests/rt-tests.git/snapshot/rt-tests-1.5.tar.gz |
Cyclictest is most commonly used for benchmarking real-time (RT) systems. It is one of the most frequently used tools for evaluating the relative performance of an RT. Cyclictest accurately and repeatedly measures the difference between a thread’s intended wake-up time and the time at which it actually wakes up to provide statistics about the system’s latency. It can measure latency in real-time systems caused by the hardware, the firmware, and the operating system.
An example script that runs the cyclictest benchmark and the README is available at /opt/benchmarking/rt-tests. The script performs the following runtime optimizations before executing the benchmark:
Uses Cache allocation technology (CAT) to allocate exclusive access of half the last-level cache to core 3
Assigns benchmark thread affinity to core 3
Assigns non-benchmark thread affinity to core 0
Changes the priority of benchmark thread to -20 (using: nice -n -20)
Disables kernel machine check interrupt
Increases the thread runtime utilization to infinity
To start the benchmark, run the following command:
$ /opt/benchmarking/rt-tests/start-cyclic.py
Default parameters are used unless otherwise specified. Run the script with --help to list the modifiable arguments.
See also
Sanity-Check #0 - Cyclictest Workload provides an example on how to run this benchmark and display the results.
Interpreting Cyclictest Results
Short |
Explanation |
|---|---|
T |
Thread: Thread index and thread ID |
P |
Priority: RT thread priority |
I |
Interval: Intended wake up period for the latency measuring threads |
C |
Count: Number of times the latency was measured that is, iteration count |
Min |
Minimum: Minimum latency that was measured |
Act |
Actual: Latency measured during the latest completed iteration |
Avg |
Average: Average latency that was measured |
Max |
Maximum: Maximum latency that was measured |
On a non-realtime system, the result might be similar to the following:
T: 0 ( 3431) P:99 I:1000 C: 100000 Min:      5 Act:   10 Avg:   14 Max:   39242
T: 1 ( 3432) P:98 I:1500 C:  66934 Min:      4 Act:   10 Avg:   17 Max:   39661
The right-most column contains the most important result, that is, the worst-case latency of 39.242 ms (Max value).
On a realtime-enabled system, the result might be similar to the following:
T: 0 ( 3407) P:99 I:1000 C: 100000 Min:      7 Act:   10 Avg:   10 Max:      18
T: 1 ( 3408) P:98 I:1500 C:  67043 Min:      7 Act:    8 Avg:   10 Max:      22
This result indicates an apparent short-term worst-case latency of 18 ms. According to this, it is important to pay attention to the Max values as these are indicators for outliers. Even if the system has decent Avg (average) values, a single outlier as indicated by Max is enough to break or disturb a real-time system.
According to the README from the https://git.kernel.org/pub/scm/utils/rt-tests/rt-tests.git repository:
Running cyclictest only over a short period of time and without creating appropriate real-time stress conditions is rather meaningless, since the execution of an asynchronous event from idle state is normally always quite fast, and every - even non-RT system - can do that. The challenge is to minimize the latency when reacting to an asynchronuous event, irrespective of what code path is executed at the time when the external event arrives. Therefore, specific stress conditions must be present while cyclictest is running to reliably determine the worst-case latency of a given system.
Additional Cyclictest Workload
Another script, rt_bmark.py, performs stress workloads when executing the benchmark cyclictest.
To start the benchmark, run the following command:
$ /opt/benchmarking/rt-tests/rt_bmark.py
Jitter
Benchmark |
Units |
Version |
Source |
|---|---|---|---|
Jitter |
CPU Cycles |
1.9 |
Intel Created |
The Jitter benchmark measures the execution time variation of a CPU test workload. The performance of the workload is impacted by kernel interrupts. Minimizing these interrupts also minimizes the jitter that applications could potentially experience.
An example script that runs the Jitter benchmark is available at /opt/benchmarking/jitter/jitter. The script performs the following runtime optimizations before executing the benchmark:
Uses CAT to allocate exclusive access of half the last-level cache to core 3
Assigns benchmark thread affinity to core 3
Assigns non-benchmark thread affinity to core 0
Changes the priority of benchmark thread to -20 (using: nice -n -20)
Disables kernel machine check interrupt
Increases the thread runtime utilization to infinity
To start the benchmark, run the following command:
$ /opt/benchmarking/jitter/start-benchmark.py
Default parameters are used unless otherwise specified. Run the script with --help to list the modifiable arguments.
See also
Sanity-Check #2 - Jitter Workload provides an example on how to run this benchmark and display the results.
Interpreting Jitter Results
Inst_Min   Inst_Max   Inst_jitter last_Exec  Abs_min    Abs_max      tmp       Interval     Sample No
 177205     235598      58393     177219     164702     243978    1227096064 3604948177        200      66777
The most important measurement is Inst_jitter. This measurement describes the execution time jitter during the display update interval. It is desired that Inst_jitter be as low as possible. The delta between Abs_max and Abs_min is the overall jitter spread. Ideally, the spread must be as low as possible.
LMbench
Benchmark |
Units |
Version |
Source |
|---|---|---|---|
LMbench |
Nanosecond |
3.0a9 |
LMbench is a suite of simple, portable, ANSI/C microbenchmarks for UNIX/POSIX. In general, it measures two key features: latency and bandwidth. LMbench is intended to provide system developers an insight into basic costs of key operations.
lat_mem_rd measures memory read latency for varying memory sizes and strides. The results are reported in nanoseconds per load and have been verified to be accurate to within a few nanoseconds on an SGI Indy. The entire memory hierarchy is measured, including onboard cache latency and size, external cache latency and size, main memory latency, and TLB miss latency. Only data accesses are measured; the instruction cache is not measured.
The specific cache and memory latency micro-benchmark is available at /usr/bin/lat_mem_rd.
To start this micro-benchmark, run the following command:
$ cd ~/;taskset -c $CORE_AFFINITY /usr/bin/lat_mem_rd -P 1 $MEMRD_SIZE $MEMRD_CHUNCKS &> /tmp/result_lat_mem_rd.txt
Default parameters are used unless otherwise specified (MEMRD_SIZE and MEMRD_CHUNCKS variables). Run the script with --help to list the modifiable arguments.
See also
Sanity-Check #1 - LMbench Workload provides an example on how to run this benchmark and display the results.
Interpreting LMbench Results
The output is best examined graphically. You get a graph with four plateaus. The graph should plotted in log base 2 of the array size on the X axis and the latency on the Y axis. Each stride is then plotted as a curve. The plateaus that appear correspond to the onboard cache (if present), external cache (if present, main memory latency, and TLB miss latency.
Caterpillar
Benchmark |
Units |
Version |
Source |
|---|---|---|---|
Caterpillar |
CPU Cycles |
1.1 |
Intel Created |
The Caterpillar benchmark measures the execution time variation of a memory test workload. The performance of the workload is impacted by cache misses. Using CAT improves application performance by assigning CPU affinity to cache ways, which can be dedicated to real-time applications.
An example script running the Caterpillar benchmark is available at /opt/benchmarking/caterpillar. The script performs the following runtime optimizations before executing the benchmark:
CAT to allocate exclusive access of half the last-level cache to core 3
Assign benchmark thread affinity to core 3
Assign non-benchmark thread affinity to core 0
Change priority of benchmark thread to -20 (using: nice -n -20)
Disable kernel machine check interrupt
Increase thread runtime utilization to infinity
To start the benchmark, run the following command:
$ /opt/benchmarking/caterpillar/start-benchmark.py
Default parameters are used unless otherwise specified. Run the script with --help to list the modifiable arguments.
See also
Sanity-Check #3 - Caterpillar Workload provides an example on how to run this benchmark and display the results.
Interpreting Caterpillar Results
SampleMin  SampleMax   SmplJitter  SessionMin SessionMax SessionJitter  Sample
  254023     300255       9649       233516     303071       9743        200
The most important measurement is SessionJitter. This measurement describes the maximum execution time jitter during the entire execution of the benchmark. It is desired that SessionJitter be as low as possible. The delta between SessionMax and SessionMin is the overall execution time spread. Ideally, the spread must be as low as possible.
RT-app
Benchmark |
Units |
Version |
Source |
|---|---|---|---|
rt-app |
N/A |
|
RT-app is a tool that can be used to emulate a use case. Not only the sleep and run pattern can be emulated, but also the dependency between tasks like accessing same critical resources, creating sequential wake up, or syncing the wake up of threads. The use case is described in a json like file, which is first parsed by workgen and then rt-app.
An example script that runs the RT-app tool is available at /opt/benchmarking/rt-app.
Rhealstone
Benchmark |
Units |
Version |
Source |
|---|---|---|---|
Rhealstone |
nanoseconds |
commitID c9bdf48a |
https://gitlab.denx.de/Xenomai/xenomai/tree/master/testsuite/latency |
Rhealstone is a measurement targeted specifically toward true multitasking solutions. In this benchmark, five categories of activities crucial to the performance of real-time systems are represented:
Task switching time
Preemption time
Semaphore shuffling time
Interrupt latency time
Deadlock breaking time
Two example scripts that run the Rhealstone benchmark are available at /opt/benchmarking/rhealstone. The script run_xlatency.py performs the following runtime optimizations before executing the benchmark latency:
Assign benchmark thread affinity to core 0
Assign non-benchmark thread affinity to core 1, as stress workloads.
Dump histogram to <file> in a format easily readable with
gnuplotPrint statistics of minimum, average, and maximum latencies
Sampling period set as 250 us
To start the benchmark, run the following script:
//without stress
$ cd /opt/benchmarking/rhealstone
$ ./run_xlatency.py -T <runtime>

//with stress
$ cd /opt/benchmarking/rhealstone
$ ./run_xlatency.py -T <runtime> --stress

//with stress exclude gfx for image without glxgears
$ cd /opt/benchmarking/rhealstone
$ ./run_xlatency.py -T <runtime> --stress --no-gfx
Command line parameters:
runtime: Set test period in seconds.
Default parameters are used unless otherwise specified. Run the script with --help to list the modifiable arguments. Otherwise, run the latency benchmark directly with --help to list the modifiable arguments.
See also
Sanity-Check #4 - Latency Workload provides an example on how to run this benchmark and display the results.
The script run_rhealstone_bmark.py executes benchmarks ctx_lat, deadlock_bt, preempt_lat, and semaphore_lat separately for <num> times and gets the average result for each.
To start the benchmark, run the following command:
$ cd /opt/benchmarking/rhealstone
$ ./run_rhealstone_bmark.py <num>
See also
Sanity-Check #7 - Rhealstone Workload provides an example on how to run this benchmark and display the results.
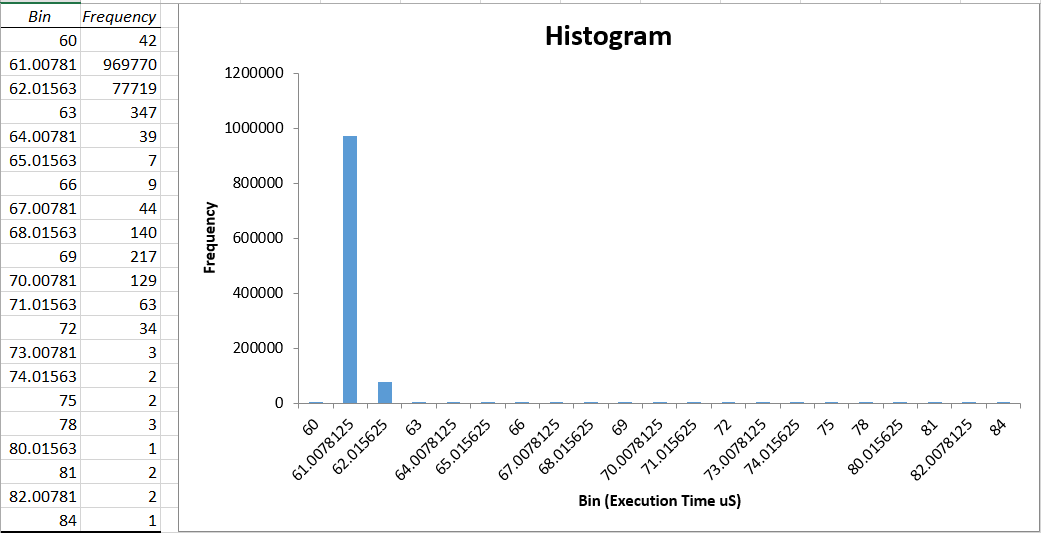
Interpreting Rhealstone Results
The results obtained from run_xlatency.py are measured interrupt latency. Lower values are better.
...
#Avg: 0.683 us
#Max: 4.656 us
#Max list: [4.656]
...
The results obtained from run_rhealstone_bmark.py are measured time to perform: task switching, preemption, semaphore shuffling, and deadlock breaking. Lower values are better.
// Task Switching
#ctx_sum is 84878.48
#ctx_avg is 848.78

// Deadlock Breaking
#dead_sum is 225127.860003
#dead_avg is 2251.278600

// Preemption
#pree_sum is 114065.000000
#pree_avg is 1140.650000

// Semaphore Shuffling
#sem_sum is 208111.365000
#sem_avg is 2081.113650
MSI Latency
Benchmark |
Units |
Version |
Source |
|---|---|---|---|
MSI Latency |
nanoseconds |
0.5.0-k |
Intel Created |
Message Signaled Interrupt (MSI) Latency measures interrupt latency for MSIs generated by a discrete or integrated peripheral device, such as the Intel® I210 Ethernet Controller Series and serviced by the IA core. This benchmark measures the MSI interrupt triggered back latency of Intel® I210 Ethernet Controller Series kernel module.
Attention
This benchmark only functions in tandem with an Intel® I210 Ethernet Controller Series.
An example script that runs the MSI latency benchmark is available at /opt/benchmarking/msi-latency. The script performs the following runtime optimizations before executing the benchmark:
Move all IRQs (except timer and cascade) to core 0
Move all rcu tasks to either core 0, 4, 5, 6, 7, except 1-3
Change the real-time attributes of all rcu tasks to
SCHED_OTHERand priority 0Change the real-time attributes of all tasks on core 1, 2 and 3 to
SCHED_OTHERand priority 0Change the real-time attributes of all tasks to
SCHED_OTHERand priority 0
Required kernel options:
isolcpus=1-3 rcu_nocbs=1-3 nohz_full=1-3 igb.blacklist=yes
To start the benchmark, run the following commands:
# cd /opt/benchmarking/msi-latency

// for preempt-rt kernel
# ./msiLatencyTest.sh <IRQ_PERIOD(ms)> <IRQ_COUNT>
//get current test result
# cat /sys/kernel/debug/msi_latency_test/current_value

// for xenomai kernel
// find Intel I210 Ethernet Controller full pci id (igbid) on your test device, by `lspci -v | grep 'Ethernet controller: Intel Corporation I210 Gigabit Network Connection'`. For example: '0000:02:00.0'
# ./run_cobalt_msi_lat.sh <unbind igbid> <IRQ_PERIOD (ms)> <runtime (s)>
//get current test result
# cat /sys/kernel/debug/msi_latency_cobalt_test/current_value
Default parameters are used when insert msi_lat.ko, unless otherwise specified. Command line parameters:
``coreSpecIRQ``:    Core on which the msi_latency test IRQ handler is run. [0 to n]
``coreSpecWQ``:     Core on which the msi_latency test work queue is run. [0 to n]
``irqSpec``:        Run IRQ as a pthread [0] or in legacy mode [1].
``irqPeriod``:      Period between interrupts in milliseconds.
``irqCount``:       Number of IRQs to send.  n > 0 will be finite.  n < 0 will be infinite.
``verbosity``:      Verbosity of periodic prints to dmesg. [0 to 3]
``offsetStart``:    Offset that is subtracted from each starting timestamp when calculating latency and generating
                histogram buckets (does not effect raw values). Mechanism used to remove delta time (nanosecond)
                from when SW requests interrupt to HW services interrupt.
``blockIRQ``:       Duration (clock ticks) for which the interrupts are blocked after requesting MSI.
See also
Sanity-Check #5 - MSI Latency provides an example on how to run this benchmark and display the results..
Interpreting MSI latency Results
************ RESULTS (ns) ************

[15996.755567] * Max: 9056
[15996.755570] * Avg: 6626
[15996.755573] * Min: 5360
The reported value is the measured time to service MSI requests to the Intel® I210 Ethernet Controller Series. Lower values are better.
MSI Jitter
Benchmark |
Units |
Version |
Source |
|---|---|---|---|
MSI Jitter |
nanoseconds |
0.1.0-m |
Intel Created |
MSI jitter benchmark tool is a benchmark tool to check the jitter of cyclical MSI from an Intel® I210 Ethernet Controller Series. This tool records each cyclical MSI timestamps in the software interrupt handler and calculates the delta between each timestamps and compares the delta with cycle time as the jitter.
Attention
This benchmark only functions in tandem with an Intel® I210 Ethernet Controller Series.
An example script that runs the MSI latency benchmark is available at /opt/benchmarking/msi-jitter. The script performs the following runtime optimizations before executing the benchmark:
Moves all IRQs (except timer and cascade) to core 0
Moves all rcu tasks to either core 0, 4, 5, 6, 7, except 1-3
$ /opt/benchmarking/msi-jitter/irq_rcu.sh
To start the benchmark, run the following commands:
$ cd /opt/benchmarking/msi-jitter
$ ./run_msijitter.sh <unbind_igb_id> <run_core> <interval(ms)> <runtime(s)>
//get current test result
$ cat /sys/kernel/debug/msi_jitter_test/current_value
Command line parameters:
unbind_igb_id:  Could get igb id need to unbind by `$lspci -v | grep 'Ethernet controller: Intel Corporation I210 Gigabit Network Connection'`.
run_core:       Set which core will handle MSI interrupt.
interval:       Set cycle time.
runtime:        Set test period.
See also
Sanity-Check #6 - MSI Jitter provides an example on how to run this benchmark and display the results.
Interpreting MSI Jitter Results
 ************ RESULTS (ns) ************

[ 4177.021407] * Max: 3184
[ 4177.023363] * Avg: 222
[ 4177.025218] * Min: 0
The reported value is the measured jitter of servicing MSI requests to the Intel® I210 Ethernet Controller Series. Lower values are better.
MMIO Latency
Benchmark |
Units |
Version |
Source |
|---|---|---|---|
MMIO Latency |
nanoseconds |
1.0 |
Intel Created |
MMIO-latency is a simple driver that creates an affinitized thread to read a virtual map physical address (Memory-mapped I/O). Memory read latency is measured. The thread is created and started on init and loops LOOPS number of times. It also provides a char device that reads the current statistic counters, by using inline assembly and kernel function to get a very close benchmark.
An example script that runs the MSI latency benchmark is available at /opt/benchmarking/mmio-latency. The script performs the following runtime optimizations before executing the benchmark:
Moves all IRQs (except timer and cascade) to core 0
Moves all rcu task to either core 0, 4, 5, 6, 7, except 1-3
Changes realtime attributes of all rcu tasks to
SCHED_OTHERand priority 0Changes realtime attributes of all tasks on core 1, 2 and 3 to
SCHED_OTHERand priority 0Changes realtime attributes of all tasks to
SCHED_OTHERand priority 0
To start the benchmark, run the following command:
$ /opt/benchmarking/mmio-latency/mmioLatency.sh <MMIO_address> <block_irq(1 or 0)>
Default parameters are used unless otherwise specified.
Find the physical mmio address to test using the command: lspci -vvv -s $BDF.
For example:
$ lspci -nn ==> 00:02.0 SATA controller
$ lspci -vvv -s 00:02.0 ==> Region 0: Memory at 80002000
See also
Sanity-Check #8 - MMIO Latency Workload provides an example on how to run this benchmark and displays the results.
Interpreting MMIO Latency Results
RT Core Module
------------------------
 Stats:
  max= 6472
  avg= 2814
  min= 588
  total= 973791140
  loops= 346010

 mmio-outliers: 247
 sched-outliers: 9
The reported value is the latency in reading memory-mapped I/O. Lower values are better.
Real-Time Performance Measurement (RTPM)
Benchmark |
Units |
Version |
Source |
|---|---|---|---|
RTPM |
(See respective benchmark) |
1.6 |
Intel Created |
About RTPM
Real-time computing is critical to industrial usage scenarios. Intel real-time solutions focus on hard real-time use cases where there could be capability failures if the solutions are not executed within the allotted time span. Examples of the usage scenarios include robotics, automotive, and so on.
In a real-time computing system, several factors could impact the latency of reaction to the trigger event. These factors include hardware design, BIOS configuration, OS kernel configuration, system settings, and so on. RTPM is designed to check the key settings of the system and help you to identify the hotspot of the system for real-time performance and provide a recommendation based on the Best-known Configuration (BKC). In addition, RTPM provides a way to measure the system scheduling latency with some open source tools.
RTPM Test Modules
Real-Time Readiness Check
This module leverages one of the Intel® Time Coordinated Computing (Intel® TCC) Tools to check the many attributes that might affect real-time performance.
This module:
Verifies whether the system has a supported processor, BIOS, and OS
Checks for features, such as Intel® Turbo Boost Technology, Enhanced Intel SpeedStep® Technology, and processor power-saving states, that might affect real-time performance
Reports CPU and GPU frequencies
Operates at the OS level
Boot Command Line Check
This module checks the real-time OS boot command line parameters and recommends settings as per BKCs.
Interpreting Boot Command Line Check Results
=============================BOOT CMDLINE CHECK Mon Dec  1 00:00:00 UTC 2021=============================
----------------------------------------------------------------------------------------------------------------------------------------------------------
|CMDLINE ENTRY                                     |CURRENT VALUE                                     |BKC                                               |
----------------------------------------------------------------------------------------------------------------------------------------------------------
|processor.max_cstate                              |0                                                 |0                                                 |
|intel_idle.max_cstate                             |0                                                 |0                                                 |
|clocksource                                       |tsc                                               |tsc                                               |
|tsc                                               |reliable                                          |reliable                                          |
|nmi_watchdog                                      |0                                                 |0                                                 |
|nosoftlockup                                      |nosoftlockup                                      |nosoftlockup                                      |
|intel_pstate                                      |disable                                           |disable                                           |
|efi                                               |runtime                                           |runtime                                           |
|nohalt                                            |Missing                                           |nohalt                                            |
|nohz                                              |Missing                                           |nohz                                              |
|irqaffinity                                       |0                                                 |0                                                 |
|hugepages                                         |Missing                                           |1024                                              |
|cpufreq.off                                       |Missing                                           |1                                                 |
|i915.enable_rc6                                   |Missing                                           |0                                                 |
|i915.enable_dc                                    |Missing                                           |0                                                 |
|i915.disable_power_well                           |Missing                                           |0                                                 |
|mce                                               |Missing                                           |off                                               |
|hpet                                              |Missing                                           |disable                                           |
|numa_balancing                                    |Missing                                           |disable                                           |
|nohz_full                                         |1,3                                               |[xxxx]                                            |
|isolcpus                                          |1,3                                               |[xxxx]                                            |
|rcu_nocbs                                         |1,3                                               |[xxxx]                                            |
----------------------------------------------------------------------------------------------------------------------------------------------------------
Boot cmdline check finished.
Kernel Configuration Check
This module checks the real-time OS kernel configuration and recommends settings as per BKCs.
Interpreting Kernel Configuration Check Results
=============================KERNEL CONFIGURATION CHECK Mon Dec  1 00:00:01 UTC 2021=============================
Kernel config file: /boot/config-5.4.115-rt57-intel-pk-standard+
----------------------------------------------------------------------------------------------------------------------------------------------------------
|KERNEL CONFIG ENTRY                               |CURRENT VALUE                                     |BKC                                               |
----------------------------------------------------------------------------------------------------------------------------------------------------------
|CONFIG_SMP                                        |CONFIG_SMP=y                                      |CONFIG_SMP=y                                      |
|CONFIG_PREEMPT_RCU                                |CONFIG_PREEMPT_RCU=y                              |CONFIG_PREEMPT_RCU=y                              |
|CONFIG_GENERIC_IRQ_MIGRATION                      |CONFIG_GENERIC_IRQ_MIGRATION=y                    |CONFIG_GENERIC_IRQ_MIGRATION=y                    |
|CONFIG_EXPERT                                     |CONFIG_EXPERT=y                                   |CONFIG_EXPERT=y                                   |
|CONFIG_PCIE_PTM                                   |CONFIG_PCIE_PTM=y                                 |CONFIG_PCIE_PTM=y                                 |
|CONFIG_EFI                                        |CONFIG_EFI=y                                      |CONFIG_EFI=y                                      |
|CONFIG_HIGH_RES_TIMERS                            |CONFIG_HIGH_RES_TIMERS=y                          |CONFIG_HIGH_RES_TIMERS=y                          |
|CONFIG_RCU_NOCB_CPU                               |CONFIG_RCU_NOCB_CPU=y                             |CONFIG_RCU_NOCB_CPU=y                             |
|CONFIG_HUGETLBFS                                  |CONFIG_HUGETLBFS=y                                |CONFIG_HUGETLBFS=y                                |
|CONFIG_SCHED_MC_PRIO                              |Missing                                           |CONFIG_SCHED_MC_PRIO=n                            |
|CONFIG_PREEMPT_RT                                 |# CONFIG_PREEMPT_RT is not set                    |CONFIG_PREEMPT_RT=y                               |
|CONFIG_CPU_FREQ                                   |# CONFIG_CPU_FREQ is not set                      |CONFIG_CPU_FREQ=n                                 |
|CONFIG_CPU_ISOLATION                              |CONFIG_CPU_ISOLATION=y                            |CONFIG_CPU_ISOLATION=y                            |
|CONFIG_MIGRATION                                  |CONFIG_MIGRATION=y                                |CONFIG_MIGRATION=y                                |
|CONFIG_PCIEPORTBUS                                |CONFIG_PCIEPORTBUS=y                              |CONFIG_PCIEPORTBUS=y                              |
----------------------------------------------------------------------------------------------------------------------------------------------------------
Kernel configuration check finished.
Real-Time Performance Test
This module contains the following benchmarks to evaluate the performance of the target system:
Xenomai Latency Test
Interpreting Real-Time Performance Test Results
=============================Real-Time PERFORMANCE TEST Mon Dec  1 00:00:02 UTC 2021=============================
Real-time task CPU affinity is set to core 1 by default. Stress is added to other CPU cores if enabled. It's recommended to isolate the core 1 for real-time task from others.
To change the default test duration. Please modify test_cfg file.
>>> Processing cyclictest...Test duration: 60s
Setup cyclictest test on core 1
Max CPUs = 4
# /dev/cpu_dma_latency set to 0us
Thread 0 Interval: 750
Thread 0 using cpu 1.
      0:       0:   11283
      0:    4622:    8008
      0:    9850:    8163
      ....
      0:  224591:    8132
      0:  226642:    7752
      0:  234162:    7799
      0:  236213:    6943
T: 0 (728815) P:99 I:250 C: 240000 Min:   5000 Act:    5365 Avg:    5458 Max:   12065
>>> Processing msi_latency test...Test duration: 60s
Msi-latency test finish, max:3936 ns, avg:2682 ns, min:2464 ns
>>> Processing msi_jitter test...Test duration: 60s
Msi-jitter test finish, max:1552 ns, avg:304 ns, min:0 ns
>>> Processing rhealstone...Test cycles: 2
[1082.17, 1087.4]
[1082.17, 1087.4]
ctx_sum is 2169.57
ctx_avg is 1084.79


[5623.126667, 5631.456667]
[5623.126667, 5631.456667]
dead_sum is 11254.583334
dead_avg is 5627.291667


[3264.865, 3357.005]
[3264.865, 3357.005]
sem_sum is 6621.870000
sem_avg is 3310.935000


[2137.07, 2103.635]
[2137.07, 2103.635]
pree_sum is 4240.705000
pree_avg is 2120.352500


>>> Processing mmio_latency test...Test duration: 300s
MMIO-Latency test finish, max:4365 ns, avg:2286 ns, min:1555 ns
Real-time performance test finished.
To start the benchmark, run the following commands:
$ /opt/benchmarking/rtpm/rtpm_exec.sh -p "./output" -n "report.csv" -a
The results are logged in: ./output/rtpm_test.log
RTPM Command Line Parameters
Parameter |
Explanation |
|---|---|
|
Specify the path of the test file |
|
Specify the test report name in CSV format (must end with .csv) |
|
Execute Latency or Cyclictest test when running performance test |
|
Execute Rhealstone test when running performance test |
|
Execute Msi-latency test when running performance test |
|
Execute Msi-jitter test when running performance test |
|
Execute MMIO-Latency test when running performance test |
|
Enable stress when running performance test |
|
Execute all tests when running performance test |
|
Show the help list |
For more information on using Intel ECI with RTPM, refer to the guide.
CODESYS Benchmark Application
Benchmark |
Units |
Version |
Source |
|---|---|---|---|
CODESYS Benchmark |
microseconds |
1.4 |
Intel Created |
The CODESYS benchmark is an example application that allows deterministic control and test of the CODESYS SoftPLC. The application is defined such that a main task occurs every 250us. Within the main task is a configurable workload which iterates a number of user defined times. The specific workload is configurable to either: “floating point”, “arithmetic”, or “boolean” operations. Cycle execution times are measured from which minimum, maximum, and jitter measurements are derived. These measurements allow performance characterization of the CODESYS SoftPLC on the target system.
Prerequisites
A Windows system (x64 bit) to host the CODESYS IDE
An ECI image with the CODESYS Software PLC feature option enabled. (See Building ECI Targets)
A target system with the ECI image (with CODESYS Software PLC) installed (See Installing ECI Images)
Ability to modify IP address of both the Windows PC and target system
Ability to connect both the Windows PC and target system via Ethernet network
Deploying the CODESYS Benchmark
The following steps are applicable to:

This CODESYS example project was created and validated using CODESYS V3.5 SP15 Patch 4 + (64-bit). Project compatibility differences may occur when changing CODESYS version.

See also
This section assumes you are already familiar with CODESYS and how to deploy a workload to the CODESYS Linux runtime. For a detailed tutorial, see section: Application #2: CODESYS OPC UA Publish/Subscribe
Extract the
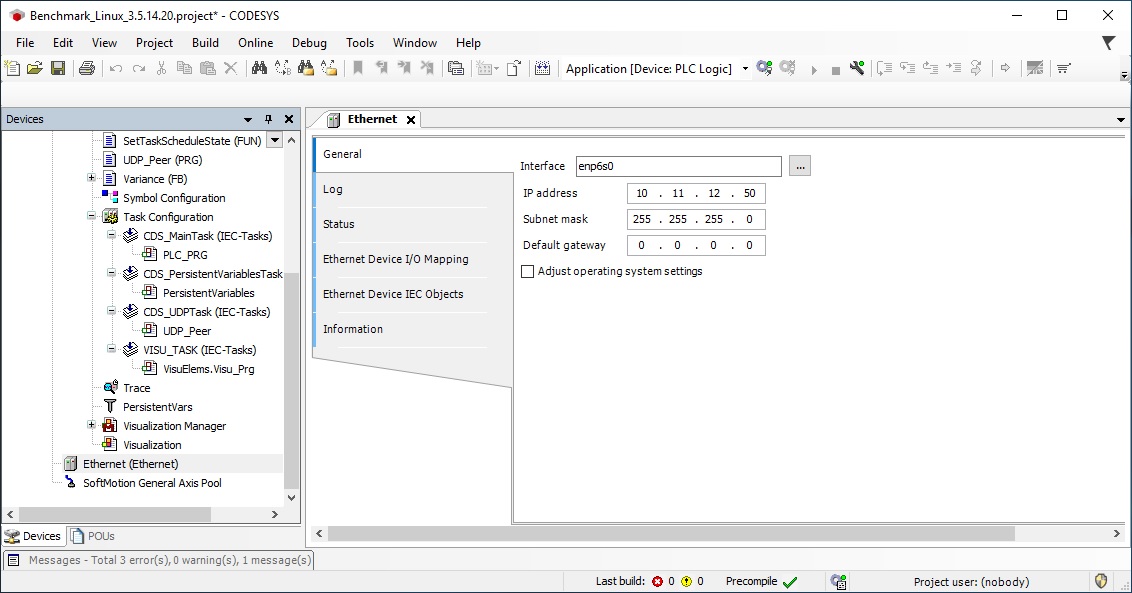
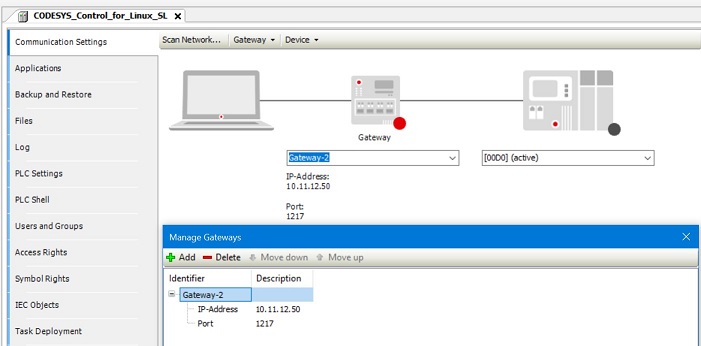
CODESYS_Example_Applications.ziparchive provided with the ECI bundle. Navigate to the Benchmark directory. Double-click Benchmark_Linux_3.5.15.40.project to open the project with CODESYS.The benchmark application was created assuming the CODESYS Linux runtime has an IP address of
10.11.12.50on interfaceeno1. However, you can change these if required. You need to change three IP addresses to accomplish this:IP Address #1:
IP address in the CODESYS application (change via the CODESYS IDE) - Double-click “Ethernet” from the Devices pane. The IP address settings are displayed on the left pane.
IP Address #2:
IP address of the Windows PC running CODESYS IDE. Windows is configured with
10.11.12.55to be on the same subnet as the CODESYS Linux runtime.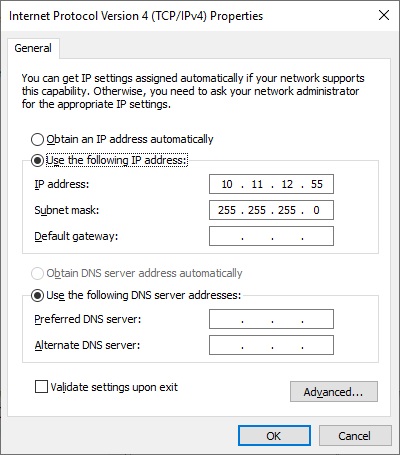
The following steps are applicable to:
IP Address #3:
IP address of target system running the CODESYS Linux runtime.
Run the following commands on the target system to change the IP address of device interface to
10.11.12.50/24. Replace<interface_name>with the name of your interface (Example:eno1):$ ip a flush dev <interface_name> $ ip a add 10.11.12.50/24 dev <interface_name>
On the target system, navigate to
/opt/benchmarking/codesys. This directory contains a number of useful scripts for improving the real-time performance of the CODESYS Linux runtime.The scripts available at
/opt/benchmarking/codesysinclude:start_CODESYS_native.sh: Optimizes the system (see list below), stops non-essential services, and restarts the CODESYS runtimestart_CODESYS_container.sh: Optimizes the system (see list below) and starts the containerized CODESYS Linux runtime with RT priority.Note
The
start_CODESYS_container.shscript assumes you have completed the CODESYS Containerization section of this guide: Microservice: CODESYS Linux Runtime & CODESYS Edge Gatewaytaskset_CODESYS.sh: Optimizes the system (see list below)
The scripts also perform the following runtime optimizations:
Uses CAT to allocate exclusive access of half the last-level cache to core 3
Assigns benchmark thread affinity to core 3
Assigns non-benchmark thread affinity to core 0
Changes the priority of benchmark thread to 90 (using: chrt -f 90)
Disables kernel machine check interrupt
Increases the thread runtime utilization to infinity
Run the
start_CODESYS_native.shscript available at/opt/benchmarking/codesysto reload the CODESYS Linux runtime in preparation of the benchmark:$ cd /opt/benchmarking/codesys $ ./start_CODESYS_native.sh
Build, download, and run the CODESYS Benchmark as outlined in Application #2: CODESYS OPC UA Publish/Subscribe. The CODESYS Benchmark is configured to host a web visualization at
http://10.11.12.50:8080. If the benchmark is working correctly, the web visualization should be similar to following image: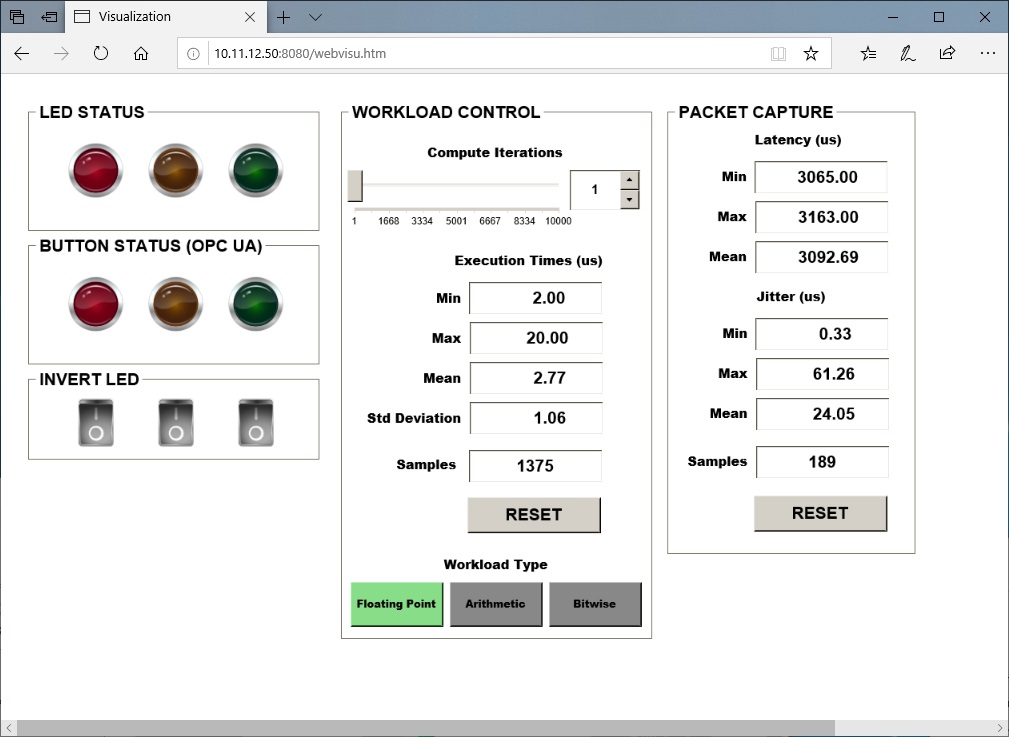
Run the
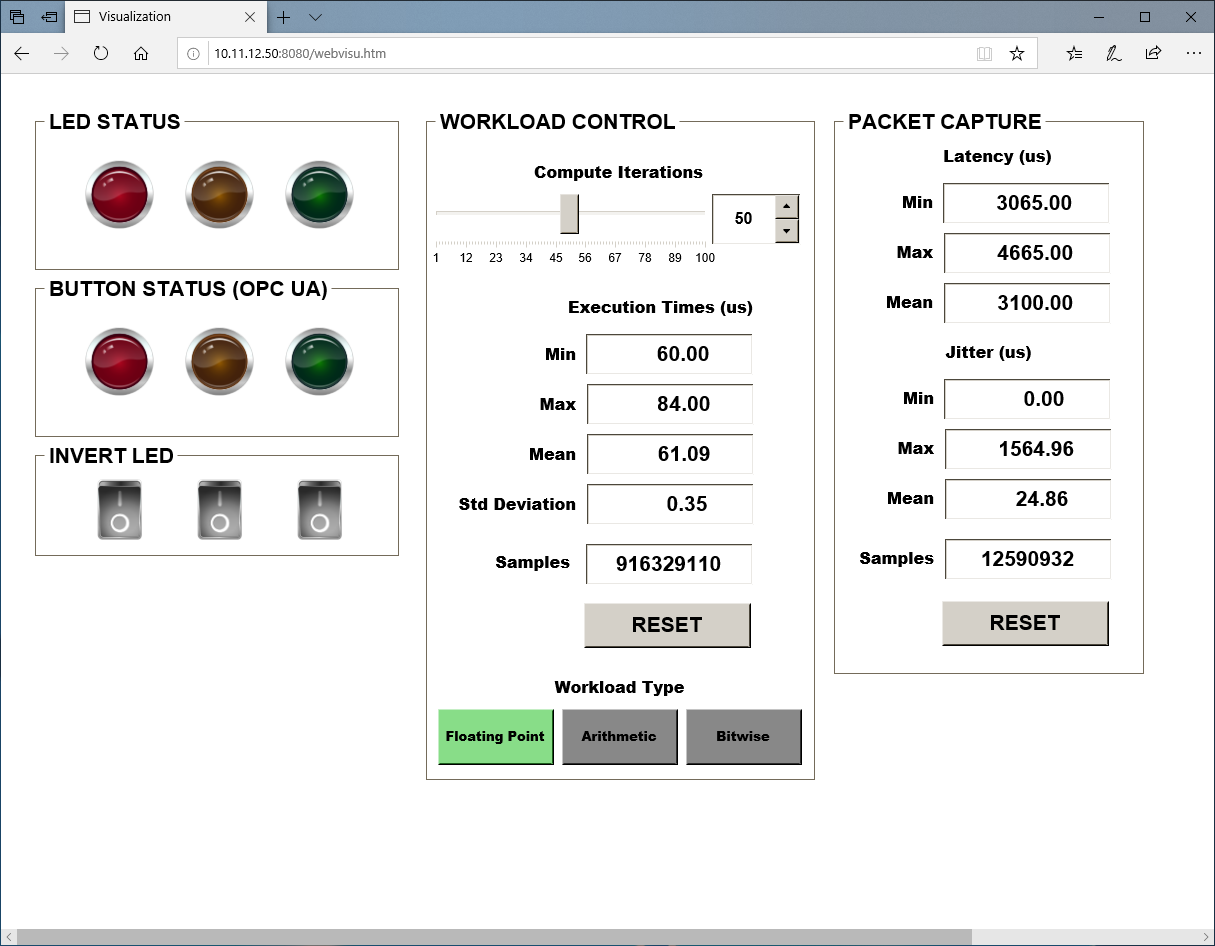
taskset_CODESYS.shscript at/opt/benchmarking/codesysto move all CODESYS tasks to CPU 3 and change the priority of all CODESYS tasks to RT:$ ./taskset_CODESYS.shUse the RESET buttons in the web visualization to reset the statistics after running the
taskset_CODESYS.shscript. This CODESYS benchmark demonstrates that real-time performance can be achieved using the ECI image in combination with proper kernel and runtime configurations.Use the slider and arrow buttons to increase or decrease the number of workload iterations per cycle.
The colored LEDs are connected to variables mapped to an OPC UA server. Connect an OPC UA client to the CODESYS OPC UA server to read/write the values. You can download a popular free OPC UA client called UaExpert from: https://www.unified-automation.com/products/development-tools/uaexpert.html.
Performance Sanity-Check Testing
The following section is applicable to:
Sanity-Check #0 - Cyclictest Workload
Script rt_bmark.py
Step #0 - Setup the workload with the following input configuration:
One thread per core
Use clock_nanosleep instead of posix interval timers
Set number of threads to the number of cpus and same priority of all threads
Priority = 99
Timer interval on core 0: 100[us]
Interval increment for each core: 20[us]
Number of loops (on core 0): 30000
Step #1 - Run the workload with the following command in target shell (locally or remotely over SSH or UART console):
$ /opt/benchmarking/rt-tests/rt_bmark.py
You can consider that the sanity check has passed, if stdout results are similar to the data provided in the following links:
Script start-cyclic.py
Step #0 - Setup the workload with the following input configuration:
Core affinity = 3
Priority = -20 (nice -n -20)
Total loops = 100000
Thread distance = 1
Interval = 1000.
SSH session (not using integrated GPU)
Step #1 - Run the workload with the following command in target shell (locally or remotely over SSH or UART console):
$ /opt/benchmarking/rt-tests/start-cyclic.py
You can consider that the sanity check has passed, if stdout results are similar to the data provided in the following links:
Sanity-Check #1 - LMbench Workload
Step #0 - Setup the workload with the following input configuration:
Core affinity ($CORE_AFFINITY) = 1
Memory total ($MEMRD_SIZE) = 192M
Stride size ($MEMRD_CHUNCKS) = 512
SSH session (not using integrated GPU)
Step #1 - Run the workload with the following command in target shell (locally or remotely over SSH or UART console):
$ cd ~/;taskset -c $CORE_AFFINITY /usr/bin/lat_mem_rd -P 1 $MEMRD_SIZE $MEMRD_CHUNCKS &> /tmp/result_lat_mem_rd.txt
You can consider that the sanity check has passed, if stdout results are similar to the data provided in the following links:
Sanity-Check #2 - Jitter Workload
Step #0 - Setup the workload with the following input configuration:
Core affinity = 3
Priority = -20
nice -n -20Noisy Neighbor
stress-ngaffinity = 0CAT used to assign
0x0fto COS0CAT used to assign
0xf0to COS1SSH session (not using integrated GPU)
Step #1 - Run the workload with the following command in target shell (locally or remotely over SSH or UART console):
$ /opt/benchmarking/jitter/start-benchmark.py
You can consider that the sanity check has passed, if stdout results are similar to the data provided in the following links:
Sanity-Check #3 - Caterpillar Workload
Step #0 - Setup the workload with the following input configuration:
Core affinity = 3
Priority = -20
nice -n -20Noisy Neighbor
stress-ngaffinity = 0CAT used to assign
0x0fto COS0CAT used to assign
0xf0to COS1SSH session (not using integrated GPU)
Step #1 - Run the workload with the following command in target shell (locally or remotely over SSH or UART console):
$ /opt/benchmarking/caterpillar/start-benchmark.py
You can consider that the sanity check has passed, if stdout results are similar to the data provided in the following links:
Sanity-Check #4 - Latency Workload
Step #0 - Setup the workload with the following input configuration:
Core affinity = 1
Noisy Neighbor
stress-ngaffinity = 2Test time = 10800 seconds
SSH session (not using integrated GPU)
Step #1 - Run the workload with the following command in target shell (locally or remotely over SSH or UART console):
$ cd /opt/benchmarking/rhealstone && python run_xlatency.py -T 10800 --stress
//exclude the gfx stress for image without glxgears
$ python run_xlatency.py -T 10800 --stress --no-gfx
The test results will be saved as a file named latency_test_results.txt. You can consider that the sanity check has passed, if stdout results are similar to the data provided in the following links:
Sanity-Check #5 - MSI Latency
Step #0 - Setup the workload with the following input configuration:
coreSpecIRQ= 1coreSpecWQ= 1irqSpec= 1irqPeriod= 10irqCount= 2000000verbosity= 1offsetStart= 0blockIRQ= 0
Step #1 - Run the workload with the following command in target shell (locally or remotely over SSH or UART console):
# cd /opt/benchmarking/msi-latency

// for preempt-rt kernel
# ./msiLatencyTest.sh 10 2000000
//get current test result
# cat /sys/kernel/debug/msi_latency_test/current_value

// for xenomai kernel
// find Intel i210 NIC's full pci id (igbid) on your test device, by `lspci -v | grep 'Ethernet controller: Intel Corporation I210 Gigabit Network Connection'`. For example: '0000:02:00.0'
# ./run_cobalt_msi_lat.sh <unbind igbid> 10 21600
//get current test result
# cat /sys/kernel/debug/msi_latency_cobalt_test/current_value
You can consider that the sanity check has passed, if stdout results are similar to the data provided in the following links:
Sanity-Check #6 - MSI Jitter
Step #0 - Setup the workload with the following input configuration:
core affinity = 1
runtime = 21600(s)
interval = 100(ms)
unbind_igb_id (checked by
lspci)
Step #1 - Run the workload with the following command in target shell (locally or remotely over SSH or UART console):
$ cd /opt/benchmarking/msi-jitter
$ ./irq_rcu.sh
$ ./run_msijitter.sh <unbind_igb_id> 1 100 21600
//get current test result
$ cat /sys/kernel/debug/msi_jitter_test/current_value
You can consider that the sanity check has passed, if stdout results are similar to the data provided in the following links:
Sanity-Check #7 - Rhealstone Workload
Step #0 - Setup the workload with the following input configuration:
Core affinity = 1
Total loops = 100
Noisy Neighbor
stress-ngaffinity = 2SSH session (not using integrated GPU)
Step #1 - Run the workload with the following command in target shell (locally or remotely over SSH or UART console):
$ cd /opt/benchmarking/rhealstone && ./run_rhealstone_bmark_stress.py 100
The test result will be saved as a file named rhealstone_test_result.txt. You can consider that the sanity check has passed, if stdout results are similar to the data provided in the following links:
Sanity-Check #8 - MMIO Latency Workload
Step #0 - Setup the workload with the following input configuration:
Configure non-RT related tasks to core 0
$ ./opt/benchmarking/mmio-latency/configRTcores.sh
Find the physical mmio address using either of the following options:
Option 1:
//Find the physical mmio address to test by `lspci -vvv -s $BDF`.
eg: $ lspci -nn ==> 00:02.0 SATA controller; $ lspci -vvv -s 00:02.0 ==> Region 0: Memory at 80002000.
Option 2:
$ lspci -k
$ cat /proc/bus/pci/devices | grep <name> | awk '{print $4}'
Step #1 - Run the workload with the following command in target shell (locally or remotely over SSH or UART console):
$ ./opt/benchmarking/mmio-latency/mmioLatency.sh <mmio-address>
You can consider that the sanity check has passed, if stdout results are similar to the data provided in the following links:
Sanity-Check #9 - CODESYS PlcLogic Workload
Step #0 - Setup the workload with the following input configuration:
Step #1 - Run the workload with the following command in target shell (locally or remotely over SSH or UART console):
$ systemctl restart codesyscontrol.service
$ /opt/benchmarking/codesys/start_CODESYS_native.sh
You can consider that the sanity check has passed, if stdout results are similar to the data provided in the following links:
Sanity-Check #10 - Smokey
Step #0 - Setup the with the following input configuration:
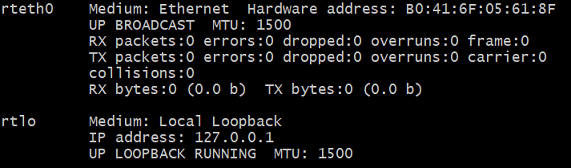
Setup rtnet
//find RT_DRIVER
$ lspci -v | grep ' Ethernet controller: Intel Corporation I210 Gigabit Network Connection ' -A 15
e.g.

01:00.0 Ethernet controller: Intel Corporation I210 Gigabit Network Connection (rev 03)
        Subsystem: Intel Corporation I210 Gigabit Network Connection
        Flags: bus master, fast devsel, latency 0, IRQ 18
        Memory at a1100000 (32-bit, non-prefetchable) [size=128K]
        I/O ports at 3000 [size=32]
        Memory at a1120000 (32-bit, non-prefetchable) [size=16K]
        Capabilities: [40] Power Management version 3
        Capabilities: [50] MSI: Enable- Count=1/1 Maskable+ 64bit+
        Capabilities: [70] MSI-X: Enable+ Count=5 Masked-
        Capabilities: [a0] Express Endpoint, MSI 00
        Capabilities: [100] Advanced Error Reporting
        Capabilities: [140] Device Serial Number 00-07-32-ff-ff-6f-ee-90
        Capabilities: [1a0] Transaction Processing Hints
        Kernel driver in use: rt_igb
        Kernel modules: igb, rt_igb
$ sudo vim /etc/rtnet.conf
//
$ RT_DRIVER="rt_igb"
// Change to the device address you found,here is my example address
$ REBIND_RT_NICS="0000:01:00.0"
Start rtnet
$ sudo /usr/sbin/rtnet master
$ sudo /usr/sbin/rtifconfig rteth0 up
$ sudo /usr/sbin/rtifconfig
Query cmd
$ sudo /usr/lib/xenomai/testsuite/smokey --list
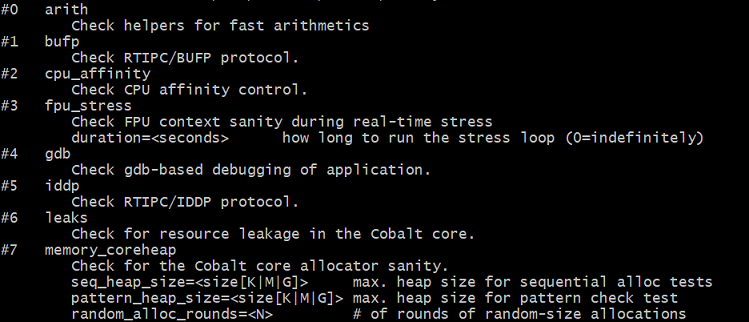
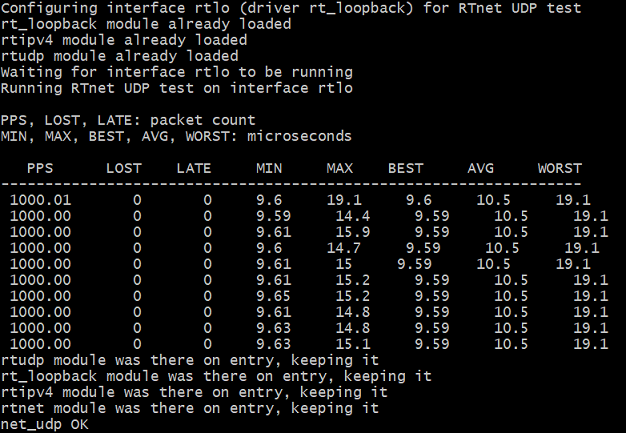
Step #1 - Run the workload with the following command in target shell (locally or remotely over SSH or UART console):
//Default
$ sudo /usr/lib/xenomai/testsuite/smokey --run=12 --verbose=2
//Optional
$ sudo /usr/lib/xenomai/testsuite/smokey --run=12 --verbose=2 rtnet_driver=rt_loopback rtnet
parameters |
description |
|---|---|
–run |
run [portion of] the test list, 12 = |
–verbose |
set verbosity to desired level, default = 1 |
|
choose network driver, default = |
|
choose network interface, default = |
|
choose packet rate . default=1000, it means send/recv udp datagram per 1000000000/1000 ns = 1ms |
|
choose test duration. default=10, it means test lasts 10 seconds |
You can consider that the sanity check has passed, if stdout results are as shown in the following figure, that is, no-zero and no-n/a values.
Sanity-Check #11 - Xenomai XDDP-stream Runtime
Step #0 - Reset the trace buffer and snapshot:
$ echo 0 > /sys/kernel/debug/tracing/events/enable
$ echo 0 > /sys/kernel/debug/tracing/trace
$ echo 0 > /sys/kernel/debug/tracing/snapshot
Step #1 - Start tracing the required events:
$ echo 1 > /sys/kernel/debug/tracing/events/sched/enable
$ echo 1 > /sys/kernel/debug/tracing/events/sched/sched_switch/enable
$ echo 1 > /sys/kernel/debug/tracing/events/sched/sched_wakeup/enable

$ echo 1 > /sys/kernel/debug/tracing/events/cobalt_core/cobalt_timer_start/enable
$ echo 1 > /sys/kernel/debug/tracing/events/cobalt_core/cobalt_timer_expire/enable
$ echo 1 > /sys/kernel/debug/tracing/events/cobalt_core/cobalt_timer_stop/enable
$ echo 1 > /sys/kernel/debug/tracing/events/cobalt_core/cobalt_clock_exit/enable
$ echo 1 > /sys/kernel/debug/tracing/events/cobalt_core/cobalt_clock_entry/enable

$ echo 1 > /sys/kernel/debug/tracing/events/cobalt_core/cobalt_switch_context/enable
$ echo 1 > /sys/kernel/debug/tracing/events/cobalt_core/cobalt_schedule/enable
$ echo 1 > /sys/kernel/debug/tracing/events/cobalt_core/cobalt_synch_wakeup/enable
$ echo 1 > /sys/kernel/debug/tracing/events/cobalt_core/cobalt_synch_sleepon/enable
$ echo 1 > /sys/kernel/debug/tracing/events/cobalt_core/cobalt_synch_wakeup_many/enable
Step #2 - Get cobalt_timer and cobalt_synch, for example, timer: 18446641218937430680, synch: 18446744072525039056.
$ echo 'hist:keys=timer if ( name == "xddp-stream")' >> events/cobalt_core/cobalt_timer_start/trigger
$ echo 'hist:keys=synch' >> /sys/kernel/debug/tracing/events/cobalt_core/cobalt_synch_sleepon/trigger

$ /usr/demo/xddp-stream

$ cat /sys/kernel/debug/tracing/events/cobalt_core/cobalt_timer_start/hist
# event histogram
#
# trigger info: hist:keys=timer:vals=hitcount:sort=hitcount:size=2048 if ( name == "xddp-stream") [active]
#

{ timer: 18446641218937430680 } hitcount:        548

$ cat /sys/kernel/debug/tracing/events/cobalt_core/cobalt_synch_sleepon/hist
# event histogram
#
# trigger info: hist:keys=synch:vals=hitcount:sort=hitcount:size=2048 [active]
#

{ synch: 18446641218937439520 } hitcount:          1
{ synch: 18446744072525039056 } hitcount:        943
Step #3 - Enable XDDP-stream runtime and non-rt thread read and write back latency hist trigger:
# Runtime
echo 'hist:keys=timer:start_t=common_timestamp.usecs if ( timer==18446641218937430680)' >> events/cobalt_core/cobalt_timer_expire/trigger
echo 'xddp_stream_runtime u64 runtime' >> synthetic_events
echo 'hist:keys=timer:run_t=common_timestamp.usecs-$start_t:onmatch(cobalt_core.cobalt_timer_expire).xddp_stream_runtime($run_t) if ( name=="xddp-stream" )' >> events/cobalt_core/cobalt_timer_start/trigger
echo 'hist:keys=runtime:sort=runtime' >> events/synthetic/xddp_stream_runtime/trigger

# Non-rt thread read and write back latency
echo 'hist:keys=synch:sleep_t=common_timestamp.usecs:clock=mono if ( synch==18446744072525039056 )' >> /sys/kernel/debug/tracing/events/cobalt_core/cobalt_synch_sleepon/trigger
echo 'rw_latency u64 lat' >> /sys/kernel/debug/tracing/synthetic_events
echo 'hist:keys=synch:sampling=common_timestamp.usecs-$sleep_t:onmatch(cobalt_core.cobalt_synch_sleepon).rw_latency($sampling):clock=mono if ( synch==18446744072525039056 )' >> events/cobalt_core/cobalt_synch_wakeup/trigger
echo 'hist:keys=lat:sort=lat' >> events/synthetic/rw_latency/trigger
Step #4 - Rerun XDDP-stream demo:
$ /usr/demo/xddp-stream
Step #5 - If stdout results format as followed ie. no-zero and no-n/a values it is PASS, otherwise is FAIL sanity-check
$ cat /sys/kernel/debug/tracing/events/synthetic/xddp_stream_runtime/hist
# event histogram
#
# trigger info: hist:keys=runtime:vals=hitcount:sort=runtime:size=2048 [active]
#

{ runtime:         42 } hitcount:          1
{ runtime:         49 } hitcount:          1
{ runtime:         50 } hitcount:          1
{ runtime:         51 } hitcount:          2
{ runtime:         52 } hitcount:          1
{ runtime:         53 } hitcount:          3
{ runtime:         54 } hitcount:          3
...


$ cat /sys/kernel/debug/tracing/events/synthetic/rw_latency/hist
# event histogram
#
# trigger info: hist:keys=lat:vals=hitcount:sort=lat:size=2048 [active]
#

{ lat:         18 } hitcount:         14
{ lat:         19 } hitcount:         16
{ lat:         20 } hitcount:          1
{ lat:         25 } hitcount:          1
{ lat:         26 } hitcount:          1
...
Sanity-Check #12 - IEC 61131-3 PLCopen IEC 61131-3 KALMAN + PID workload
Step #0 - Open the project PLCopen_ecs-internal-testsuite_Linux_3.5.14.40.projectarchive with CODESYS
Right-click on KALMAN + PID workload Application from the Devices pane, then click on “Set Active Application” to activate the workload.
Double-click on KALMAN + PID workload Device name from the Devices pane to bring up the gateway settings, then scan network. Please also set IP address follow IP Address #2 & IP Address #3 in section Deploying the CODESYS Benchmark.
Step #1 - Run the start_CODESYS_native.sh script on target to reload the CODESYS Linux runtime in preparation of the benchmark
$ /opt/benchmarking/codesys/start_CODESYS_native.sh
Step #2 - Build, login and start running the CODESYS Benchmark
Step #3 - Get scorecard on target when the test ends (about 5min)
$ cd /var/opt/codesys/PlcLogic
$ vi IEC-61131-3_process-automation_scorecard*date*.txt
You can consider that the sanity check has passed, if stdout results are similar to the following, that is, no-zero and no-n/a values:
--- PLCopen 61131-3 Process Automation testcase scorecard ---
Target: Id 5 Type 4102 Version 3.5.14.40
Test at: 2020-3-6-11_21
Platform: IEC 61131-3 workload -  Control Function Block
Extern: Extern
Code: Ram
Measured timer resolution [ns]: 91
Measured overhead of SysTimeGetNs [ns]: 88.1744

Test (all values in ns)              Avg       Min       Max    StdDev Num Calls
--------------------------------------------------------------------------------
PID 1x (REAL)                    162.091   153.826  16723.83    93.265    249910
PID 5x (REAL)                    523.246   514.826 16140.825   114.039    173257
PID 10x (REAL)                  1127.835  1114.826  16695.83   146.313    113855
KALMAN 1x filter (REAL)          409.356   393.826 16231.825   118.669    192200
KALMAN 5x filter (REAL)         1864.439  1810.826  22958.83   219.659     80326
KALMAN 10x filter (REAL)        3678.901  3570.826  20356.83   324.198     46422
Logic+Arith 1K fragment        13040.663 12712.825  75645.83  1643.232     14465
Logic+Arith 5K fragment         63906.58  62587.83  99461.83  3153.447      3472
Logic+Arith 10K fragment       127512.24 125070.83  164859.8  4163.481      1968
Sanity-Check #13 - IEC 61131-3 PLCopen Arithmetic and Logic Elementary Workload
Step #0 - Open the project PLCopen_ecs-internal-testsuite_Linux_3.5.14.40.projectarchive with CODESYS:
Right-click the Arithmetic & Logic Elementary Workload application from the Devices pane, then click Set Active Application to activate the workload.
Double-click the Arithmetic & Logic Elementary Workload Device name from the Devices pane to bring up the gateway settings, then scan network. Also, set the IP address according to IP Address #2 and IP Address #3 mentioned in Deploying the CODESYS Benchmark.
Step #1 - Run the start_CODESYS_native.sh script on target to reload the CODESYS Linux runtime in preparation of the benchmark:
$ /opt/benchmarking/codesys/start_CODESYS_native.sh
Step #2 - Build, login, and run the CODESYS benchmark.
Step #3 - Get the scorecard on target when the test ends (in about one minute):
$ cd /var/opt/codesys/PlcLogic
$ vi IEC-61131-3_alu_scorecard*date*.txt
You can consider that the sanity check has passed, if stdout results are similar to the following, that is, no-zero and no-n/a values:
--- PLCopen 61131-3 ALU Measurement scorecard ---
Target: Id 5 Type 4102 Version 3.5.14.40
Test at: 2020-3-6-14_14
Platform: ECS 1.x IEC 61131-3 scorecard - Basic Math & Logic
Extern: Extern
Code: Ram
Measured timer resolution [ns]: 91
Measured overhead of SysTimeGetNs [ns]: 88.1424

Test (all values in ns)              Avg       Min       Max    StdDev Num Calls
--------------------------------------------------------------------------------
AND (BOOL)                         2.087     1.883    57.044     1.741  85717500
AND (BYTE)                         2.018     1.843    73.005     1.641  87597500
AND (WORD)                         2.081     1.883    34.374     1.721  85665000
AND (DWORD)                        2.081     1.883    33.355     1.747  85637500
OR (BOOL)                          2.089     1.883    45.715     1.738  85730000
...
Sanity-Check #14 - IEC 61131-3 PLCopen G-Code CNC Execution Performance Workload
Step #0 - Open the project PLCopen_ecs-internal-cnc-workload_Linux_3.5.14.40.projectarchive with CODESYS:
Right-click FullMeasurement or OnlyPLCopenMeasurement application from the Devices pane, then click Set Active Application to activate the workload.
Double-click the G-Code CNC execution performance workload Device name from the Devices pane to bring up the gateway settings, then scan network. Also, set the IP address according to IP Address #2 and IP Address #3 mentioned in Deploying the CODESYS Benchmark.
Step #1 - Run the start_CODESYS_native.sh script on target to reload the CODESYS Linux runtime in preparation of the benchmark
$ /opt/benchmarking/codesys/start_CODESYS_native.sh
Step #2 - Build, login and start running the CODESYS Benchmark
Step #3 - Get scorecard on target when the test ends (about 4min)
$ cd /var/opt/codesys/PlcLogic
$ vi IEC-61131-3_cnc-and-motion-sim_scorecard*date*.txt
You can consider that the sanity check has passed, if stdout results are similar to the following, that is, no-zero and no-n/a values:
--- PLCopen IEC61131-3 Workload - gcode and motion PVA simulation control ---
Target: Id 5 Type 4102 Version 3.5.14.40
Test at: 2020-3-6-11_39
Platform: IEC 61131-3 Workload - Gcode and motion PVA simulated control
Extern: Extern
Code: Ram
Measured timer resolution [ns]: 91
Measured overhead of SysTimeGetNs [ns]: 0.0

Test (all values in ns)              Avg       Min       Max    StdDev Num Calls
--------------------------------------------------------------------------------
Decoder (no splines)           13715.767    1723.0   26590.0  5030.741        30
SmoothPath (3rd order) + CheckVelocities   3286.64    1442.0    5963.0   803.035        25
Interpolator (mixed, sigmoid)    878.176     535.0   11099.0   621.503      3234
Interpolator (mixed, quadratic)   808.787     455.0   11949.0   603.546      3335
CheckVelocities (Buffer:10000)    7256.0    7256.0    7256.0       0.0         1
...
Sanity-Check #15 - OpenGL glxgears Workload
Step #0 - Make sure mesa has been installed in the target set up with option Graphical Windowing System.
Step #1 - Run the workload with the following command in target shell (locally or remotely over SSH or UART console):
$ cd /opt/benchmarking/rhealstone && python3 run_opengl_glxglears.py -T 60 --cyclictest
Test result will be saved as a file named OpenGL_glxgears_result.txt. You can consider that the sanity check has passed, if the test results are similar to the following:
==========modify date:Mon Jul  6 10:18:22 2020==========#==============================================================================
#  Test case (1/1): Test.glxgears.OpenGL.cyclictest
#..............................................................................
#Starting stress(cyclictest)
#  Command: 'taskset -c 1 /opt/benchmarking/rt-tests/cyclictest -p 99 -i 250 -m -N'
#Starting test
#  Command: taskset -c 0 glxgears -geometry 600x800
#Hung task detection not supported
#  (File /proc/sys/kernel/hung_task_timeout_secs not found)
#10:18:22: Start of execution
#10:19:22:  1/ 1: min: 59.997
#10:19:22: Test completed. Actual execution time:0:01:00
#Terminated stress
#Min FPS: 59.997
#PASS

Test.OpenGL.cyclictest[FPS]:
59.997
PASS:Test.OpenGL.cyclictest
==========modify date:Mon Jul  6 10:19:33 2020==========#==============================================================================
#  Test case (1/1): Test.glxgears.OpenGL.latency
#..............................................................................
#Starting stress(latency)
#  Command: 'taskset -c 1 /usr/bin/latency -c 1 -p 250'
#Starting test
#  Command: taskset -c 0 glxgears -geometry 600x800
#Hung task detection not supported
#  (File /proc/sys/kernel/hung_task_timeout_secs not found)
#10:19:33: Start of execution
#10:20:33:  1/ 1: min: 59.998
#10:20:33: Test completed. Actual execution time:0:01:00
#Terminated stress
#Min FPS: 59.998
#PASS

Test.OpenGL.latency[FPS]:
59.998
PASS:Test.OpenGL.latency
Sanity-Check #16 - Smokey Net Server
Step #0 - Setup the workload with the following input configuration:
Setup rtnet for server and client
//Find the values of RT_DRIVER and REBIND_RT_NICS for setting "/etc/rtnet.conf" and the mac address for setting "/tmp/rtnet_smokey.log"
$ lspci -v | grep ' Ethernet controller: Intel Corporation I210 Gigabit Network Connection ' -A 15
e.g.

01:00.0 Ethernet controller: Intel Corporation I210 Gigabit Network Connection (rev 03)
        Subsystem: Intel Corporation I210 Gigabit Network Connection
        Flags: bus master, fast devsel, latency 0, IRQ 18
        Memory at a1100000 (32-bit, non-prefetchable) [size=128K]
        I/O ports at 3000 [size=32]
        Memory at a1120000 (32-bit, non-prefetchable) [size=16K]
        Capabilities: [40] Power Management version 3
        Capabilities: [50] MSI: Enable- Count=1/1 Maskable+ 64bit+
        Capabilities: [70] MSI-X: Enable+ Count=5 Masked-
        Capabilities: [a0] Express Endpoint, MSI 00
        Capabilities: [100] Advanced Error Reporting
        Capabilities: [140] Device Serial Number 00-07-32-ff-ff-6f-ee-90
        Capabilities: [1a0] Transaction Processing Hints
        Kernel driver in use: rt_igb
        Kernel modules: igb, rt_igb
//modify those values in the configure file according your board(both server and client)
$ sudo vim /etc/rtnet.conf

//for I210, the rt driver is "rt_igb"
$ RT_DRIVER="rt_igb"
//change to the device address of your board, here is an example address
$ REBIND_RT_NICS="0000:01:00.0"

//clear the IPADDR and NETMASK, those values will be configured by following steps
IPADDR=""
NETMASK=""

//set TDMA_MODE as master for both boards(server and client), this value will be overwrite by following steps
TDMA_MODE="master"

//clear the TDMA_SLAVES, the client address will be configure by the file "/tmp/rtnet_smokey.log"
TDMA_SLAVES=""
Create
rtnet_smokey.logfor the server:
//create file "/tmp/rtnet_smokey.log" in server then record the client address according your client board in this file, here is an example
$ sudo vim /tmp/rtnet_smokey.log
00:07:32:6B:A7:FE 192.208.1.101
Query cmd
$ sudo /usr/lib/xenomai/testsuite/smokey --list
Step #1 - Run the workload with the following command in target shell (locally or remotely over SSH or UART console):
Start rtnet and configure the IP address on server
//load all nessary modules
$ sudo /usr/sbin/rtnet start

//Server will be reconfigure by command smokey_net_server, here detach firtly, and TDMA is not enabled in this case.
$ sudo /usr/sbin/rtcfg rteth0 detach

//configure the server ip address
$ sudo /usr/sbin/rtifconfig rteth0 up 192.208.1.100 netmask 255.255.255.0
Start rtnet and configure the IP address on client
//load all nessary modules
$ sudo /usr/sbin/rtnet start

//Client will be reconfigure by following step, here detach firtly, and TDMA is not enabled in this case.
$ sudo /usr/sbin/rtcfg rteth0 detach

//configure the client ip address
$ sudo /usr/sbin/rtifconfig rteth0 up 192.208.1.101 netmask 255.255.255.0
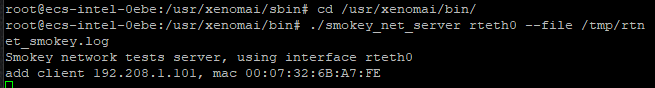
Start
smokey_net_serveron the server:
$ sudo /usr/lib/xenomai/testsuite/smokey_net_server rteth0 --file /tmp/rtnet_smokey.log
Start smokey on the client:
//configure as client mode
$ sudo /usr/sbin/rtcfg rteth0 client -c
//client announe to server
$ sudo /usr/sbin/rtcfg rteth0 announce
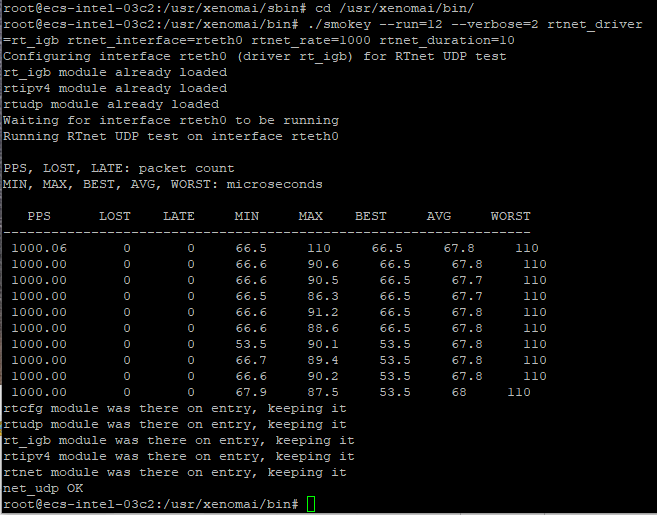
//run net_udp test case
$ sudo /usr/lib/xenomai/testsuite/smokey --run=12 --verbose=2 rtnet_driver=rt_igb rtnet_interface=rteth0 rtnet_rate=1000 rtnet_duration=10
parameters |
description |
|---|---|
–run |
run [portion of] the test list, 12 = |
–verbose |
set verbosity to desired level, default = 1 |
|
choose network driver, default = |
|
choose network interface, default = |
|
choose packet rate . default=1000, it means send/recv udp datagram per 1000000000/1000 ns = 1ms |
|
choose test duration. default=10, it means test lasts 10 seconds |
You can consider that the sanity check has passed, if stdout results are similar to the following, that is, no-zero and no-n/a values:
Note
Better use onboard ethernet ports on the target to reach best real time performance.